Importing data into Raven using HTTP with cURL
In this tutorial, we will guide you through the process of importing data into Raven Portal using the HTTP Source Brick with cURL. By following these steps, you'll learn to navigate various apps within the Portal effectively.
Chapter 1: Getting Started
To begin, let's create a data source in Raven Portal using the HTTP Source Brick. First, we need to establish a Flow.
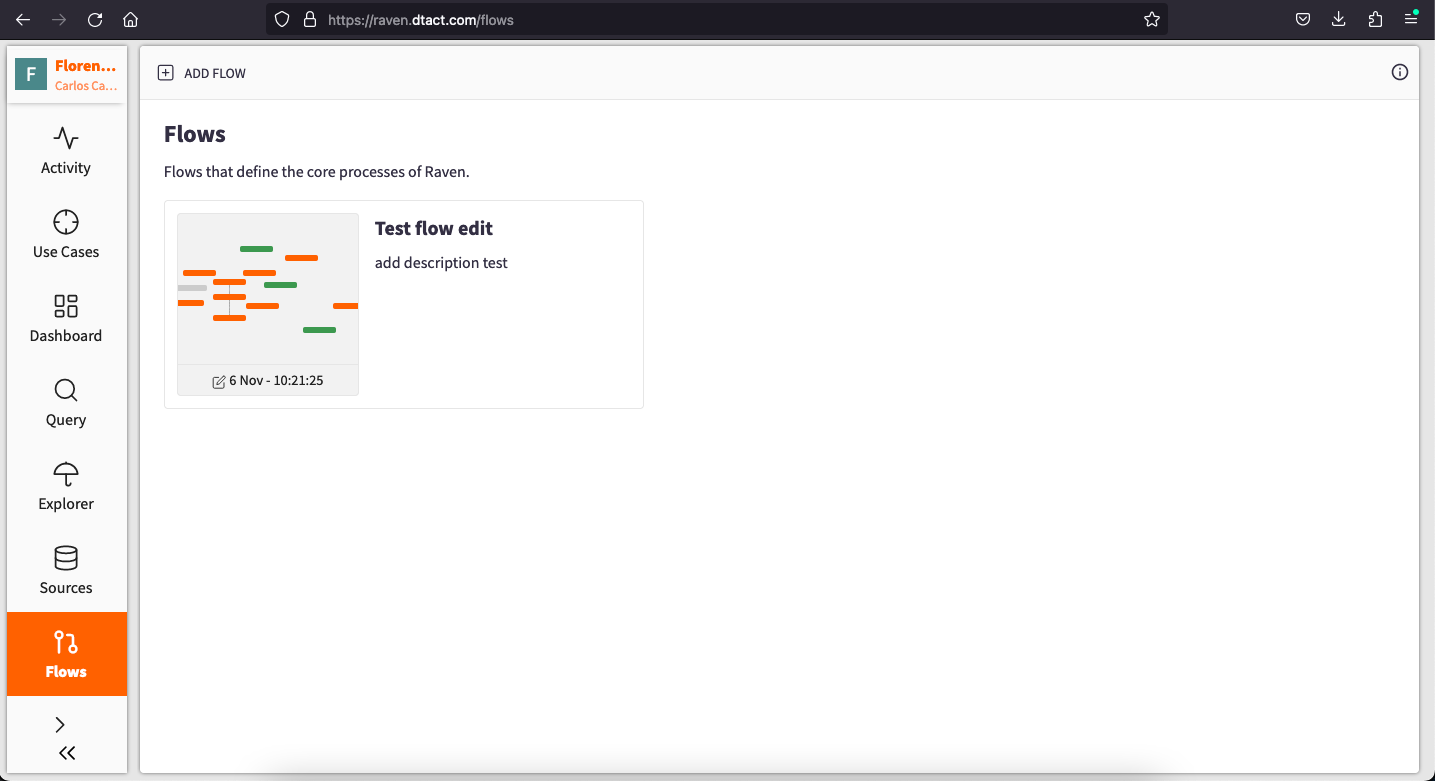
Access the Flows App: Start by selecting the "Flows" app located in the left menu of the Portal. Here, you can view all previously created Flows by your team and yourself.
Chapter 2: Creating Your Flow
Now, let's set up your first Flow within the Raven Portal:
-
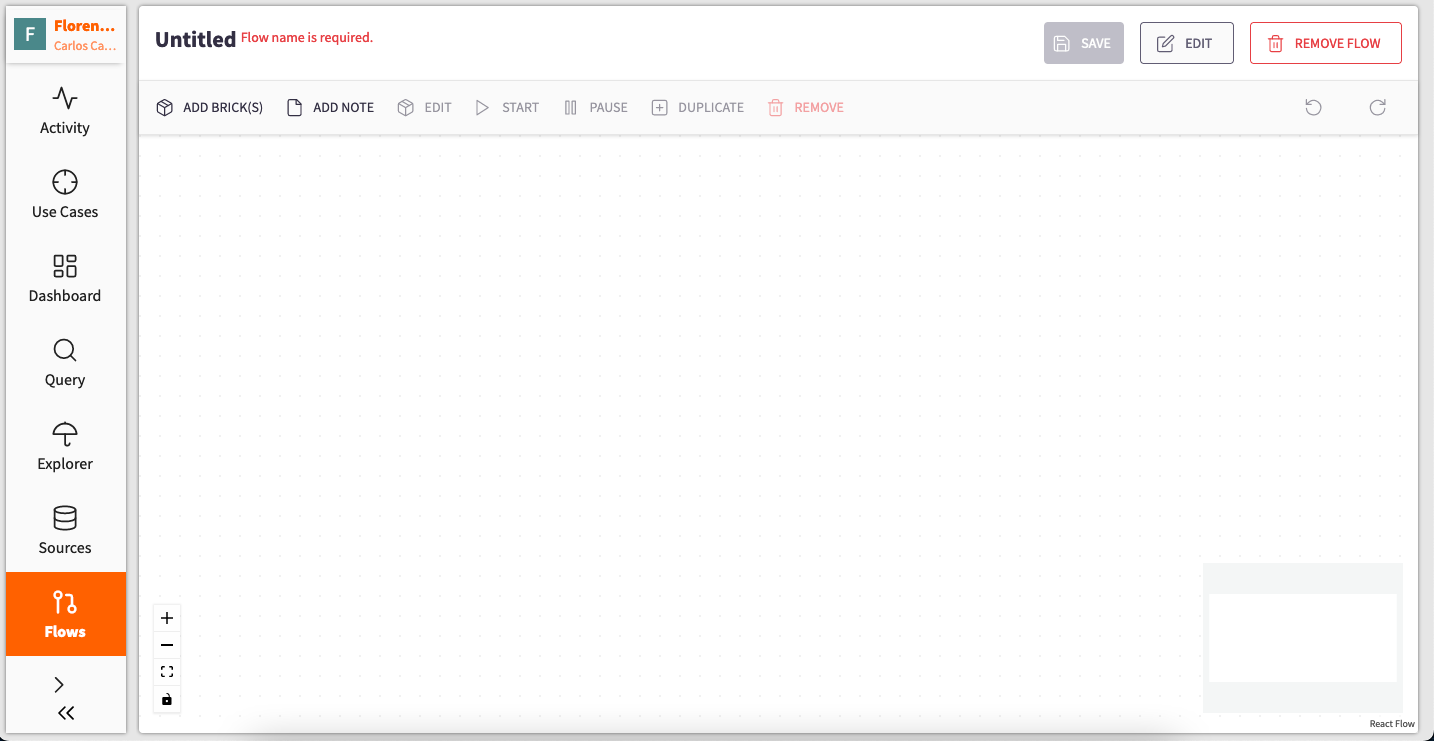
Flow Creation: Click on the "ADD FLOW" button at the top of the page. This action will open a tab where you can add Bricks and configure your Flow.
-
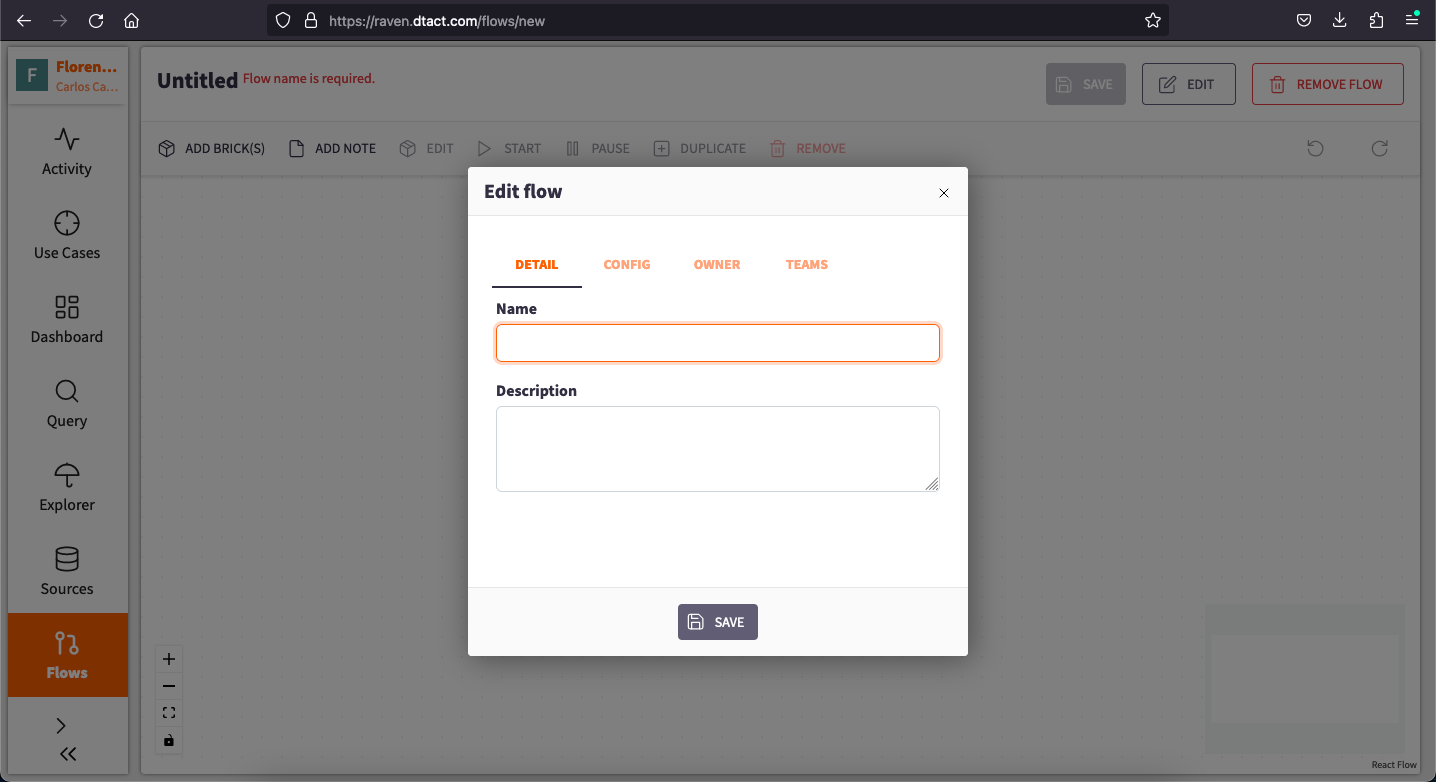
Provide Flow Details: To begin, assign a name and description to your Flow. This is essential for saving and managing your Flow. Click the "Edit" button located at the top right corner to access a pane with three sections.
-
The first section lets you specify a Name and Description.
-
The second section allows you to change the owner of the Flow.
-
The third section permits you to add teams that can access the information within your Flow.
-
-
Save Your Flow: After configuring these details, press "Save" at the bottom of the pane to create and begin working with your Flow.
Note: Always remember to save your Flow after configuration to continue adding Bricks and preserving your changes.
Chapter 3: Adding the Source Brick
Now that you've established your Flow, it's time to introduce Bricks:
-
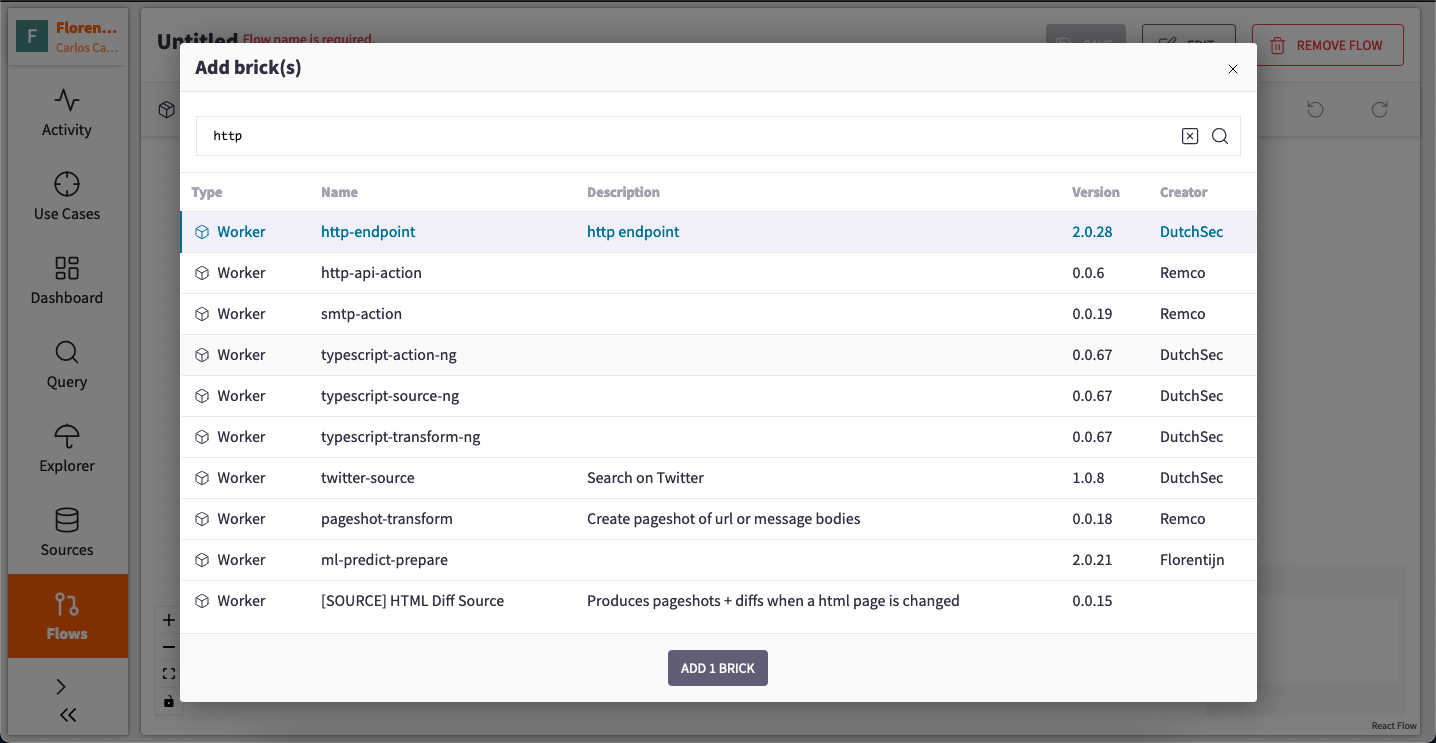
Introducing the Source Brick: To start, click on the "ADD BRICK" button to display a pane showcasing all available Bricks.
-
Selecting the HTTP Source Brick: Locate the "http-endpoint" Source Brick, which you intend to use, and press the "ADD 1 BRICK" button at the bottom of the pane.
-
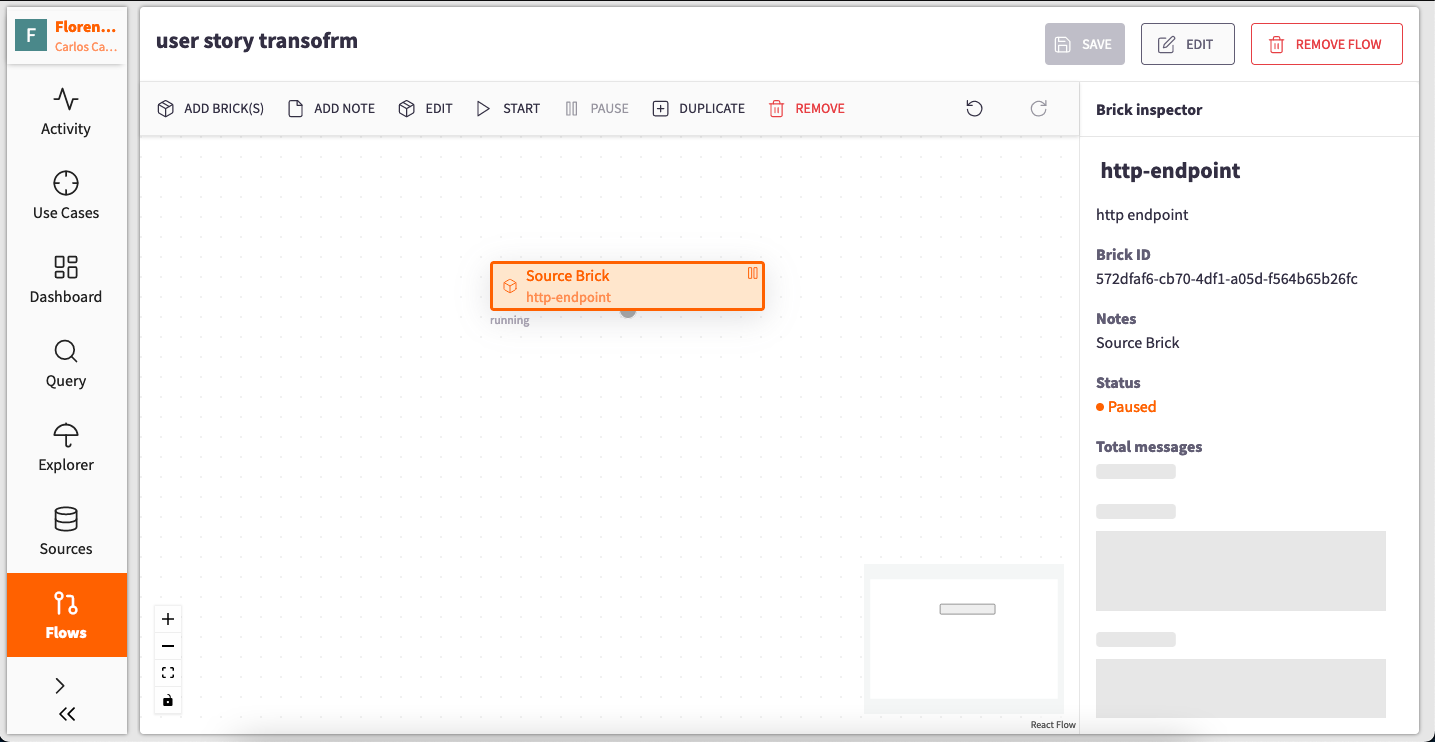
Configuring the Brick: Now that you have the desired Brick in your workspace, it is time to configure it. Start by giving it a name through a simple double-click.
-
Saving Your Progress: After providing the name, press the "Update" button at the bottom of the pane, and be sure to save your Flow on the main page to retain your changes.
-
Brick Information: Upon saving the Flow, you will find additional information about the Brick in the right pane, known as the Brick Inspector. Here, you can access details such as Brick ID, Notes, Status, and Total messages processed.
Chapter 4: Providing Data to the Source Brick
With the Source Brick in place, it's time to populate it with data using cURL with JSON validation:
-
Depending on your operating system, access the Terminal, Command Prompt, or console: Open the respective terminal application by searching for it in Spotlight if you are using macOS, in the Windows search for Windows, or in the designated location for Linux.
-
Sending Data to the Source Brick: In the Terminal, provide the necessary information to send data to the Source Brick. Here's an example command:
curl --header "Content-Type: application/json" \ --request POST \ --data '{"age": 30,"height": 185,"name": "Joaquin Hernandez"}' \ https://[BRICK ID].ingest.dtact.com
-
Configuring the Data: In the data section, specify the message you wish to send to your Source Brick, such as information about a person. In the "https" section, include your Brick's ID followed by ".ingest.dtact.com."
-
Sending Data: Press "Enter" to send this information to your Source Brick. Repeat this process while altering the data to populate your Source.
-
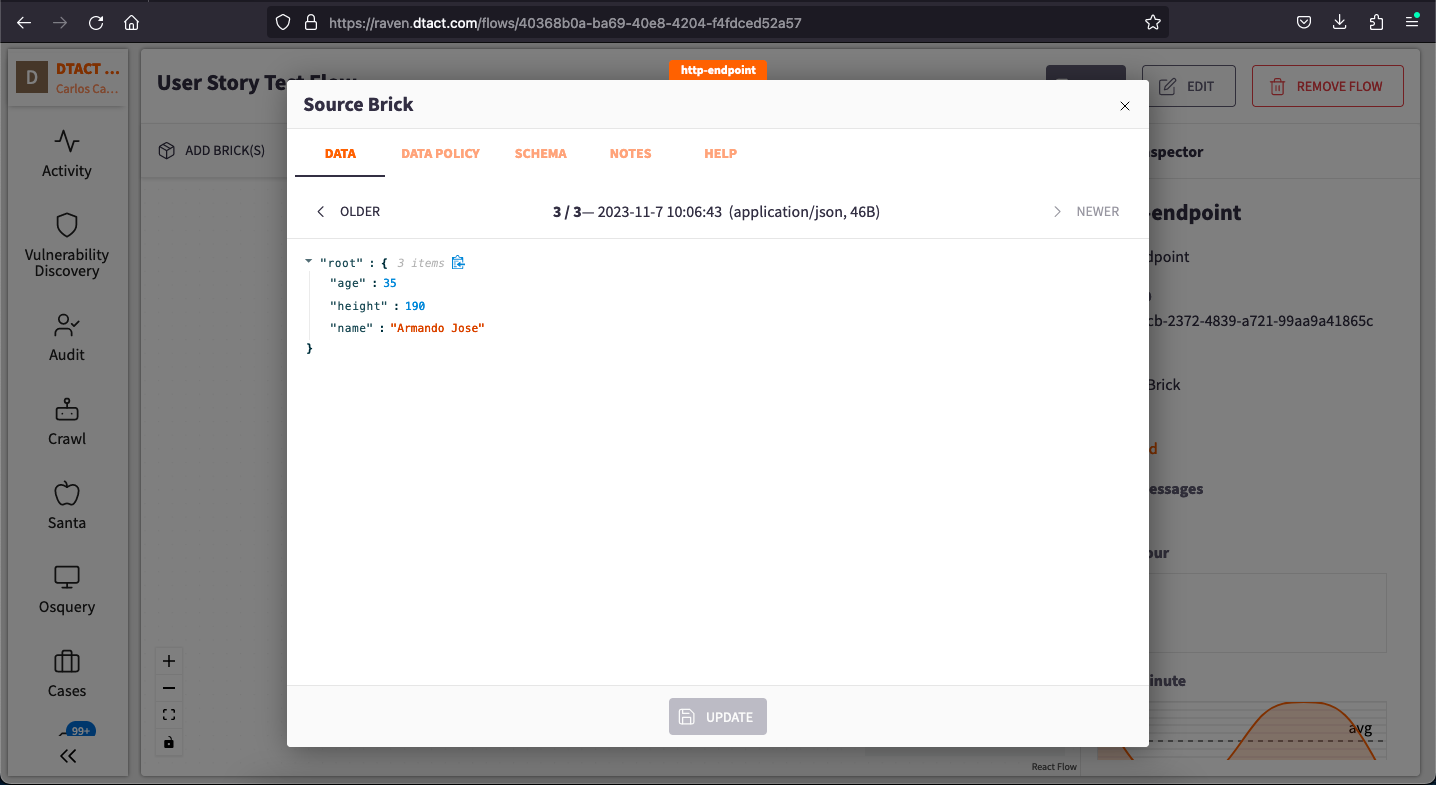
Viewing the Messages: Upon returning to the Raven Portal, double-click your Brick to view all the messages it has received. You can navigate them separately by clicking "Older" or "Newer."
Chapter 5: Transforming Data with Python
Let's change some of the data in the Brick with python's help:
-
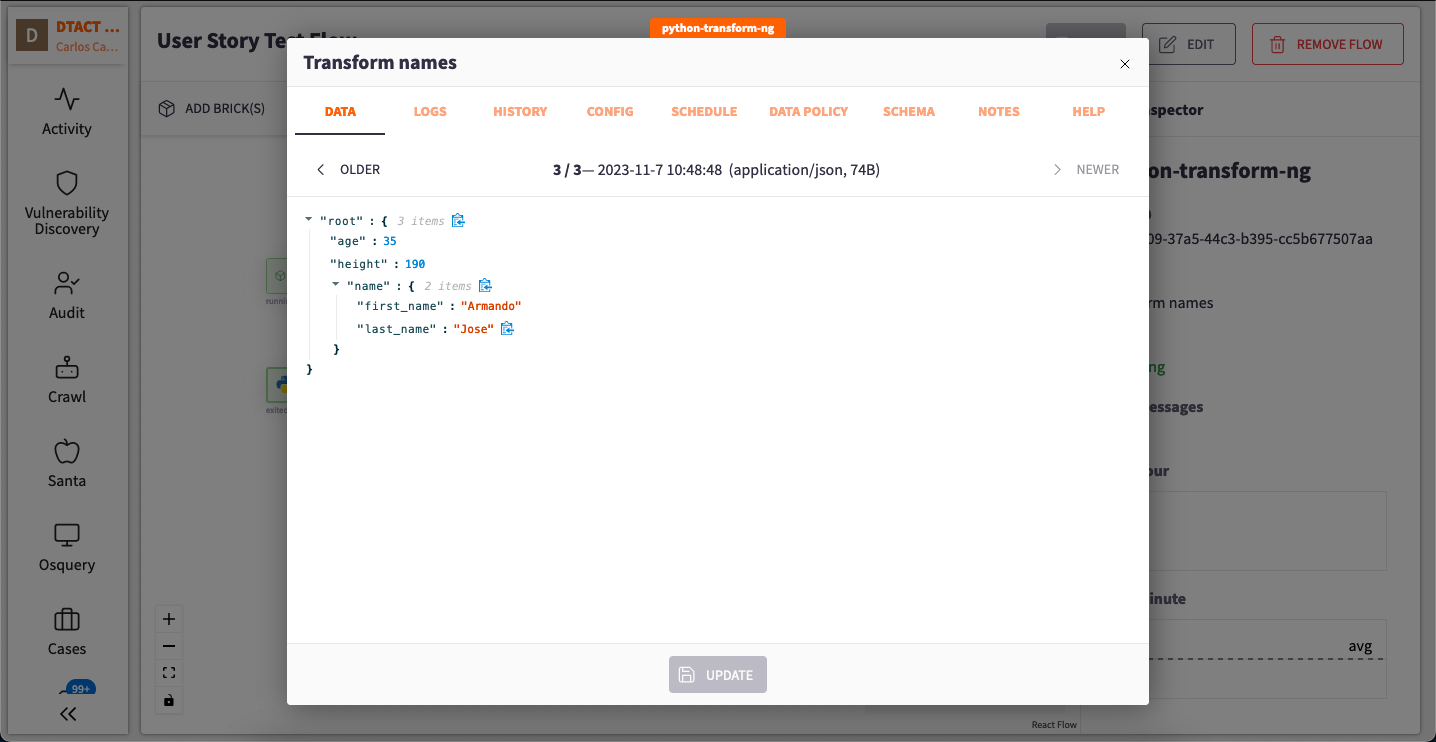
Python Transformation: Separate names into "First Name" and "Last Name" by adding a Transform Python Brick. Navigate to "ADD BRICK" again and search for the "python transform ng" Brick. After adding it to your workspace, double-click to configure the transformation.
-
Configuring the Python Brick: In the configuration pane, you can access different sections, including data, history, and configuration. Begin by adding your Python script to the Brick:
`def process(msg): pl = msg.payload name = {} name['first_name'] = pl['name'].split()[0] name['last_name'] = pl['name'].split()[-1] pl['name'] = name return pl`
-
Saving Your Progress: After configuring the Brick, press the "UPDATE" button at the bottom of the pane and, as always, save your Flow on the main page to preserve your changes.
-
Connecting Bricks: The orange color of the Bricks indicates they are "Paused." Connect the Bricks and press "Start" on each Brick to observe the transformation of data from names to first and last names.
Chapter 6: Organizing Data with Tables
To effectively manage your data, you can create Tables:
-
Save Your Flow: Before proceeding, save your Flow. Then, navigate to settings and select the Tables section.
-
Creating a Table: Click on the "CREATE TABLE" button in the top right corner. This action opens a pane for configuring your Table. Start by providing an alias or name and description. Choose a "Workflow" Table type since you want to extract information from your Flow. Lastly, select the topic or Brick from which your Table will gather data, such as the "Transform names" Python transform Brick.
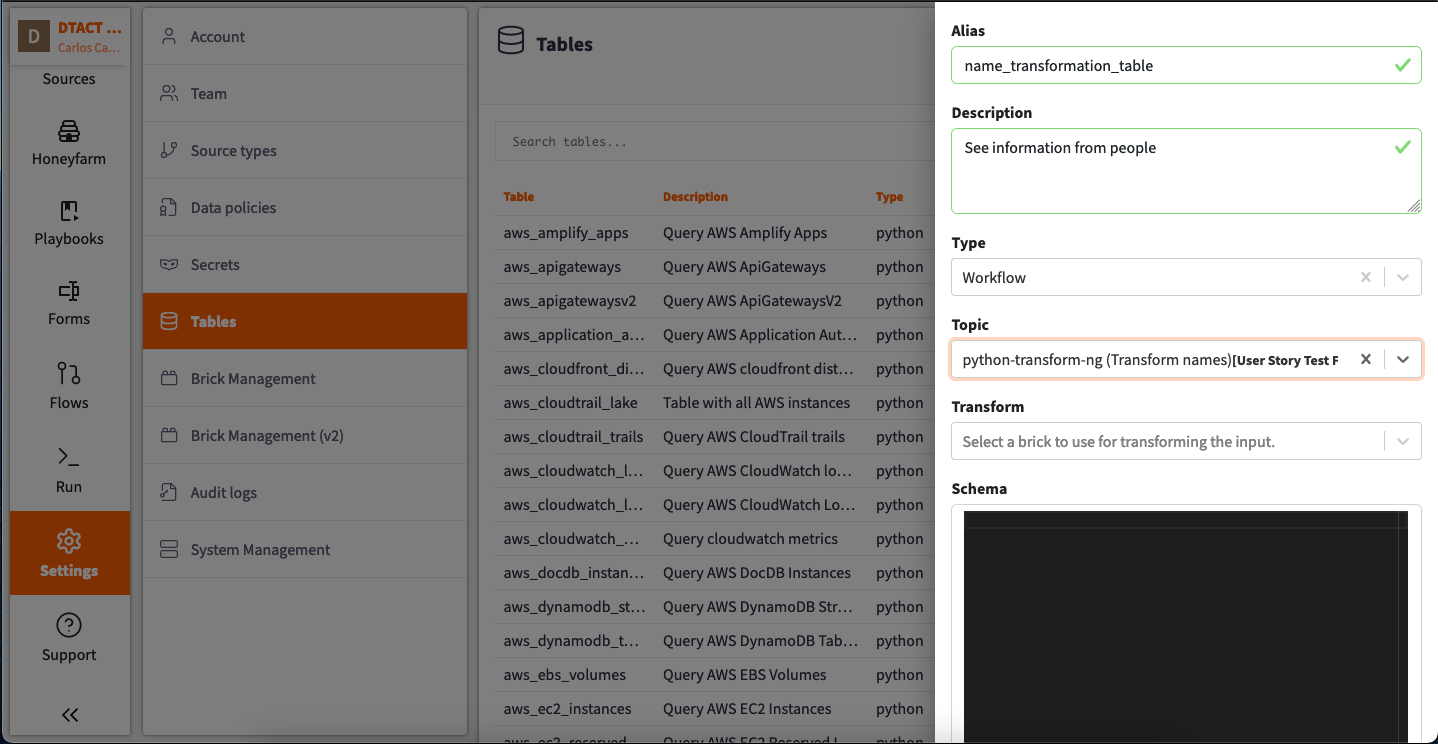
For Workflow Tables, the schema is automatically generated, eliminating the need for manual interaction with that part of the configuration.
-
Saving Your Table: In the lower part of the pane, click "CREATE TABLE" to save your Table.
Chapter 7: Visualizing Data
To visualize and query your newly created Table, use the Query app of the Portal:
-
Access the Query App: Navigate to the Query app in the Portal.
-
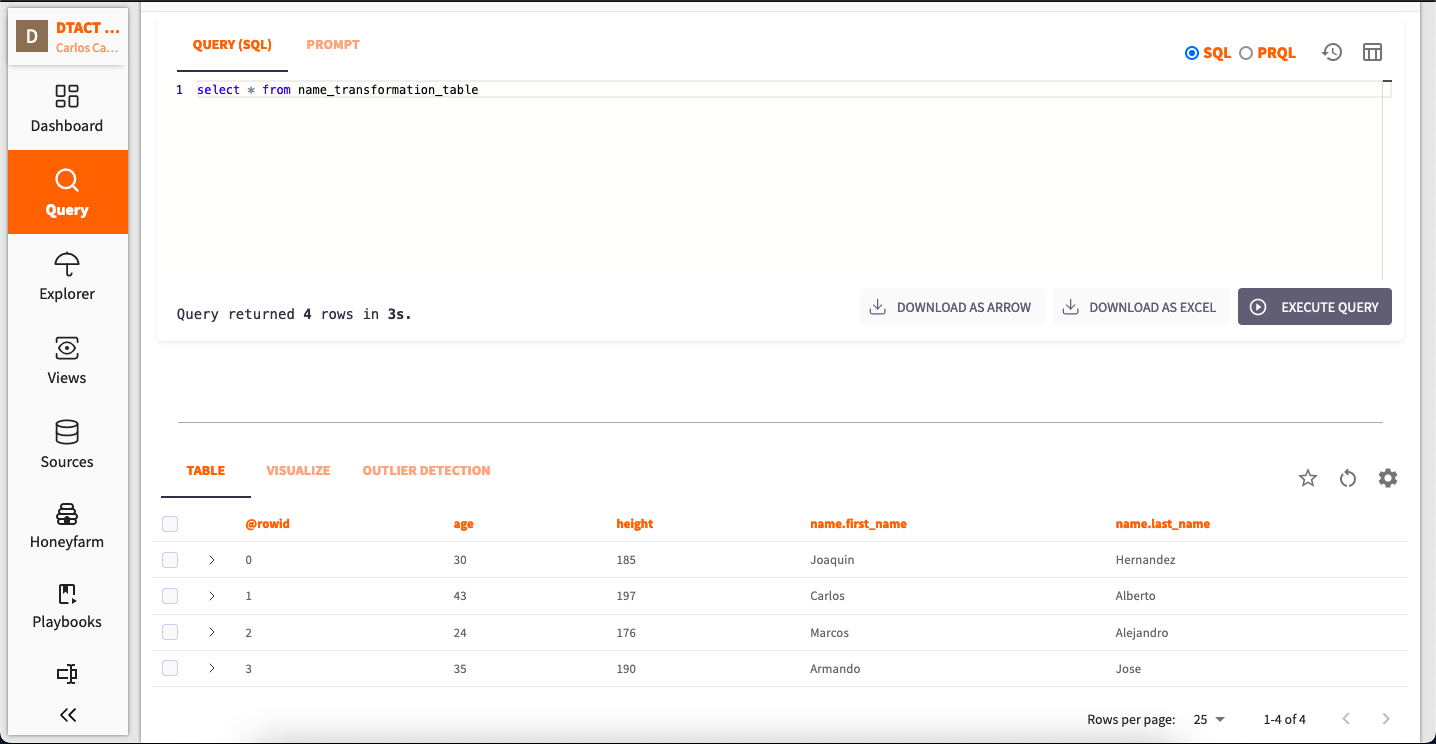
SQL Query: Employ SQL to retrieve information from the Table. For example, you can use the following query:
select * from name_transformation_table LIMIT 10Which will return ten rows of information inside the Table as specified with the "LIMIT".
-
Bookmarking the query: After executing the query, bookmark the results by clicking the star icon in the upper right corner. This way you can pick it up later from the queries list.
Chapter 8: Visualizing Data with Panes
Once you have queried your Table and retrieved the data you need, it is time to visualize it for a better understanding. The Raven Portal offers a user-friendly way to do this through Panes.
-
Navigate to the Visualization Section: After querying your data, head to the "Visualization" section within the Portal. Here, you can transform your data into meaningful charts and graphs.
-
Create Your Panes: In this example, we'll demonstrate creating two different charts to display the information:
-
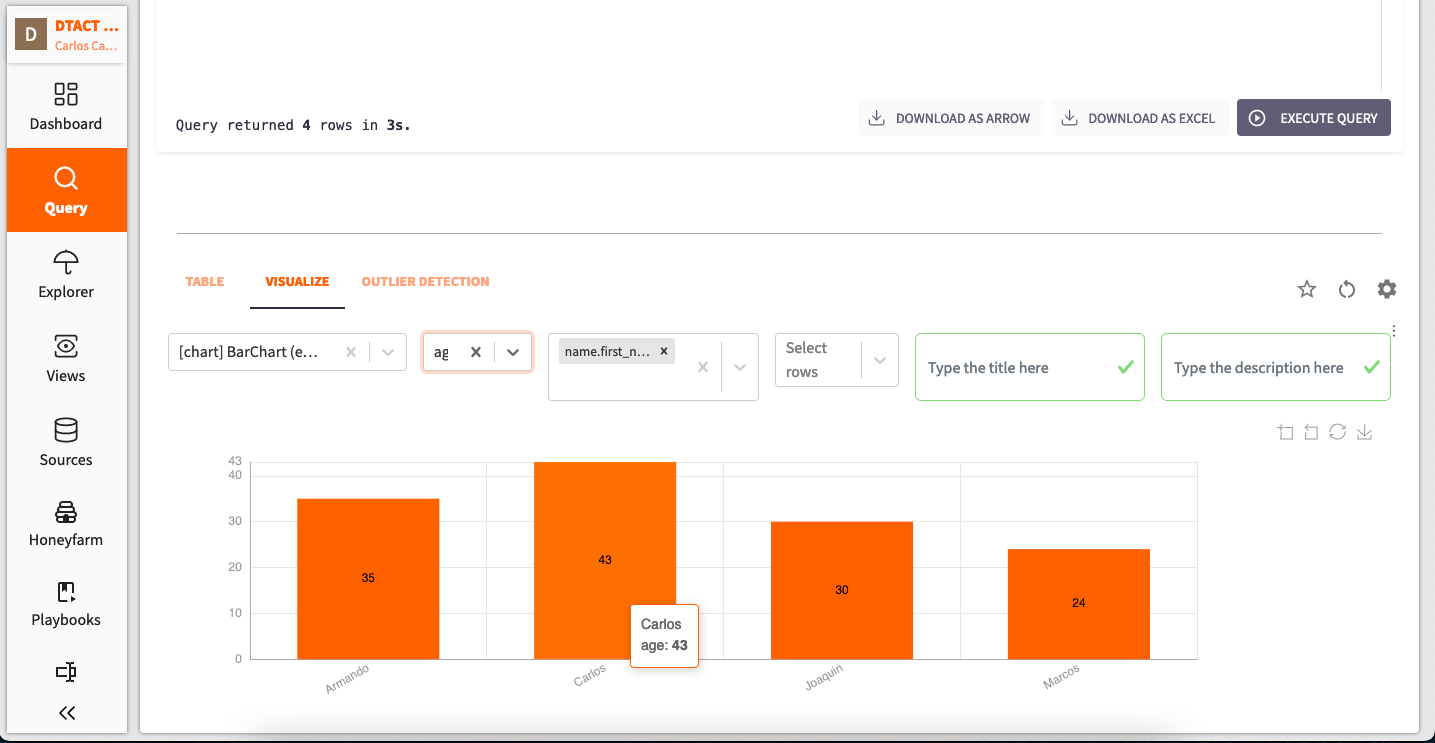
Chart 1:
Name and Age: Begin by selecting your desired chart type. For this example we will use the Bar-chart. Plot the appropriate axes to represent name and age effectively.
-
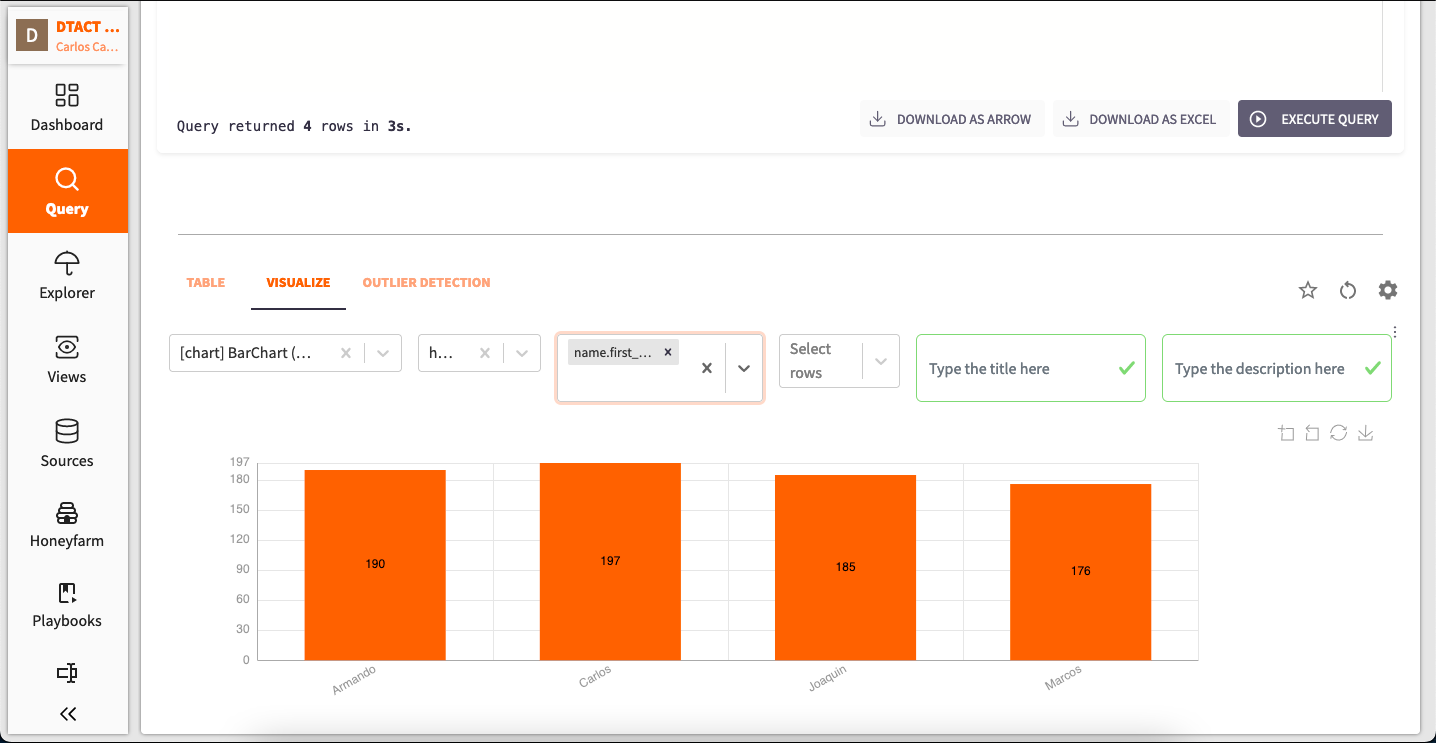
Chart 2:
Name and Height: For the second chart, choose the chart type that best suits your needs. Configure the axes to display the relationship between name and height.
-
Save Panes by clicking by giving them a name and description and clicking on the three dotted button on the right corner.
These Panes allow you to present your data in a clear and user-friendly manner, making it easier to analyze and communicate the insights derived from your data.
Chapter 9: Creating Dashboards
To gain a comprehensive view of your data, you can create personalized dashboards using the Raven Portal's Dashboard app. Here's a step-by-step guide to help you get started:
-
Access the Dashboard App: Begin by navigating to the Dashboard app in the Raven Portal.
-
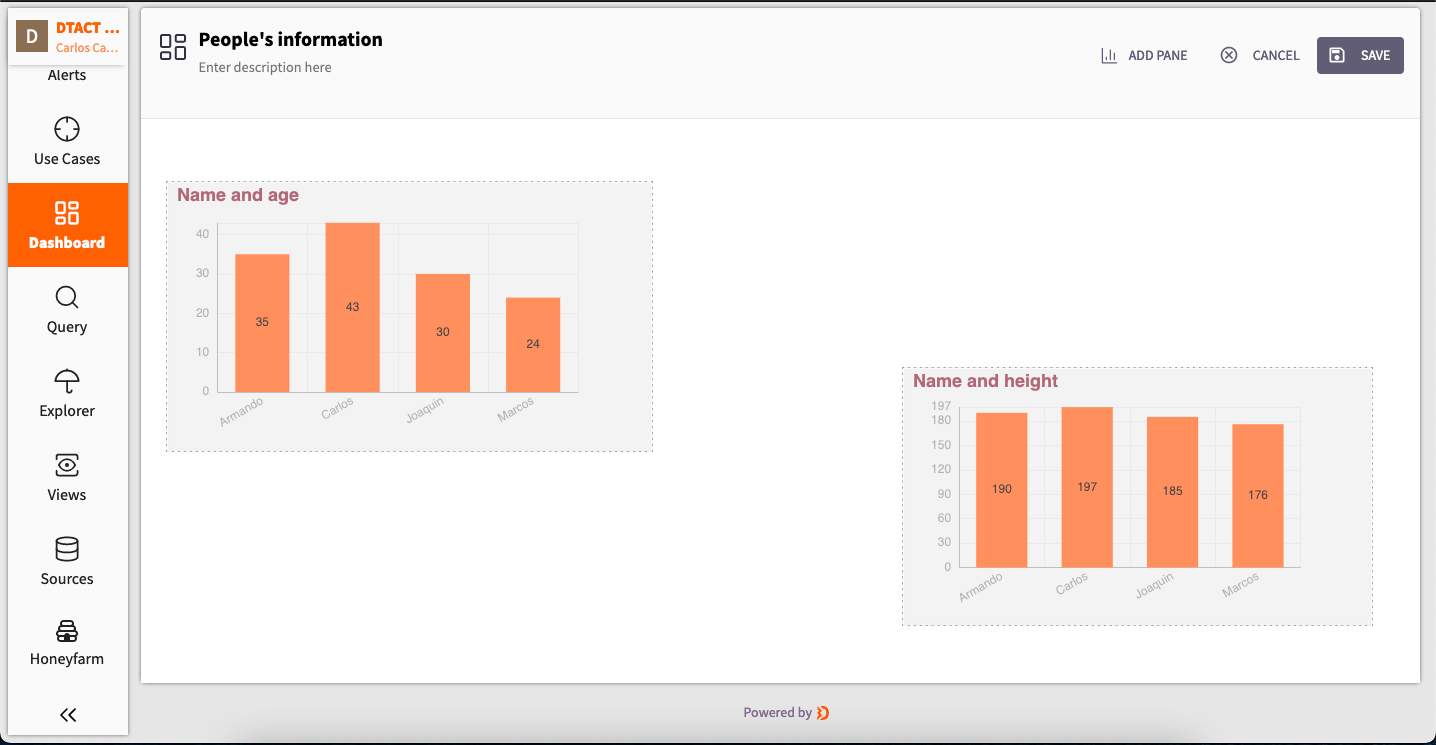
Create Your Dashboard: In the Dashboard app, you'll find the "CREATE A DASHBOARD" button positioned at the top right corner. Clicking this button opens the canvas where you can design your dashboard by adding and arranging Panes.
-
Customize Your Dashboard:
- To edit an existing dashboard, simply click on the "EDIT" button.
- Begin adding Panes to your dashboard. You can select from your already created Panes and arrange them as you like on the canvas.
- Explore the layout section to fine-tune the appearance and organization of your dashboard.
Always remember to save any modifications you make.
By creating and editing dashboards in the Dashboard app, you can bring together all your Panes in one place, providing a convenient and user-friendly way to visualize multiple aspects of your data simultaneously. This empowers you to tailor your dashboard to your specific needs, facilitating better data-driven decisions and insights.
Congratulations! You've successfully imported and transformed data in the Raven Portal using HTTP. You now have the knowledge to navigate various apps and efficiently manage data within the Portal.