Query and Indexing Tables
| Purpose | In this document, we will learn about an important feature from the Insights module: Query, which helps in indexing and visualizing tables, enhancing our data analytics capabilities. |
|---|
| Last Updated | June 24, 2024 |
|---|
A Query provides a means to index Tables and Brick data using PostgresSQL and PRQL languages. This querying process allows you to extract specific data subsets as needed.
For more information on PostgresSQL and PRQL languages follow links bellow:
Another method for Querying the data involves using Prompt. Prompt uses ChatGPT to assist in generating the Schema for your Queries. It's important to note that ChatGPT does not have access to your data; it only provides guidance to the app on how to index the Table.
You can access the "Query" app to interact with your Tables. Here's how it works:
-
Select the "Query" app to open a tab where you can index your created Tables.
-
Write your Query in the provided section.
Below the Query section, you have three buttons:
-
Download as Arrow Document
-
Download as Excel File
-
Execute Query
When you execute the Query, the indexed Table appears below in the Table pane.
Next to the Table, you will find two panes:
-
Create Insight Panes: Is a feature that empowers users to transform tabular data into visually appealing graphs and charts.
For more information on Insight Panes follow the link below:
-
Insight AI: Is a process of identifying data points that significantly differ from the majority of the data in a dataset. These data points are considered "outliers" because they are rare or unusual in comparison to the typical data points in the dataset.
Outliers can occur for various reasons, such as measurement errors, data corruption, or genuinely rare events.
At the right corner you will be able to find three icons:
- Save Query: This feature enables you to save your Query for future reference.
- Reset Table Settings to Default: If you've made any modifications to the Table, this button restores it to its default settings.
- Configure Data: This section allows you to customize how the various fields within the Tables are displayed. For instance, you can specify whether groups are defined by strings, booleans, objects, and more.
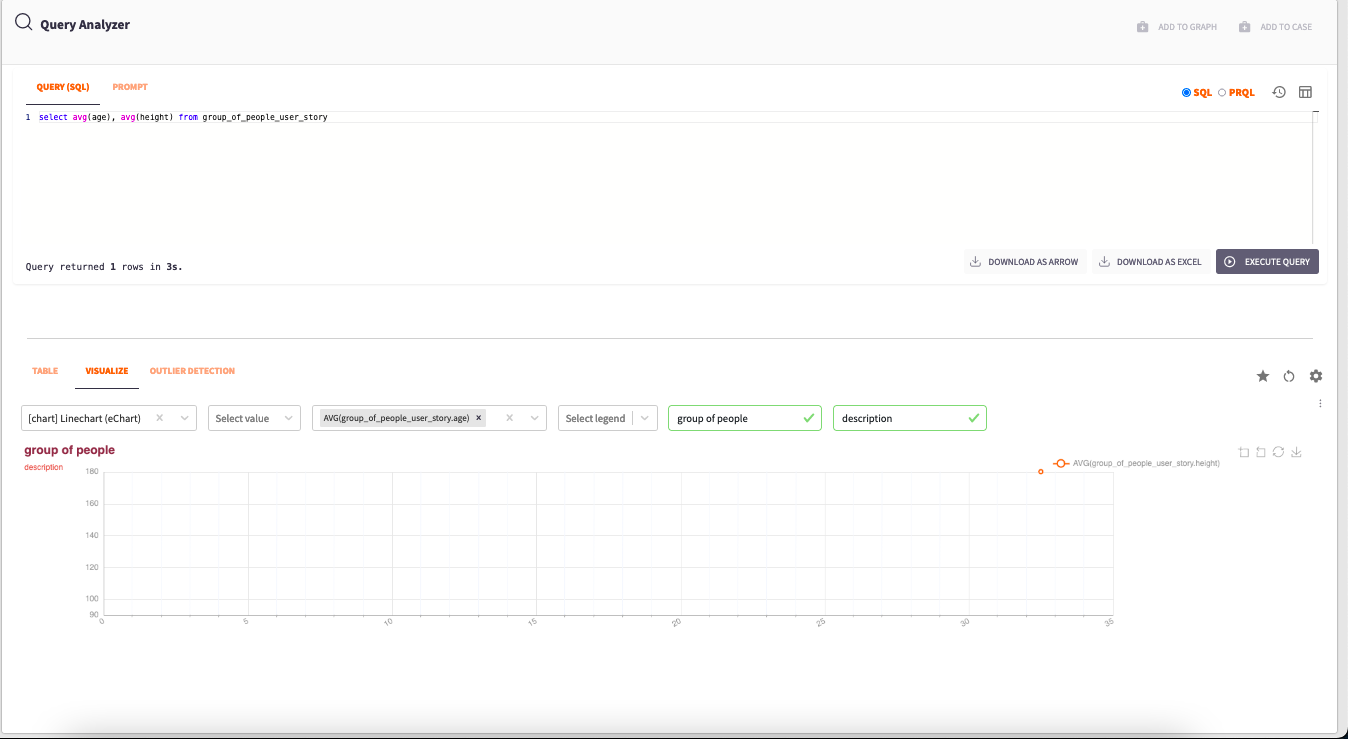
Query example with visualisation
Filtering Tables:
You can apply filters to Tables by hovering your mouse cursor over the various objects within the rows and columns. This action will reveal a funnel icon; click on this icon to filter the Table based on that object.
To remove a filter, simply click the "CLEAR" button located at the top of the Table.