Log in for the first time
| Purpose | Learn how to get started with the Raven Portal, including how to access it, upload information, and gain insights from your data. |
|---|
| Created | September 10, 2024 |
|---|

How to Log In for the First Time
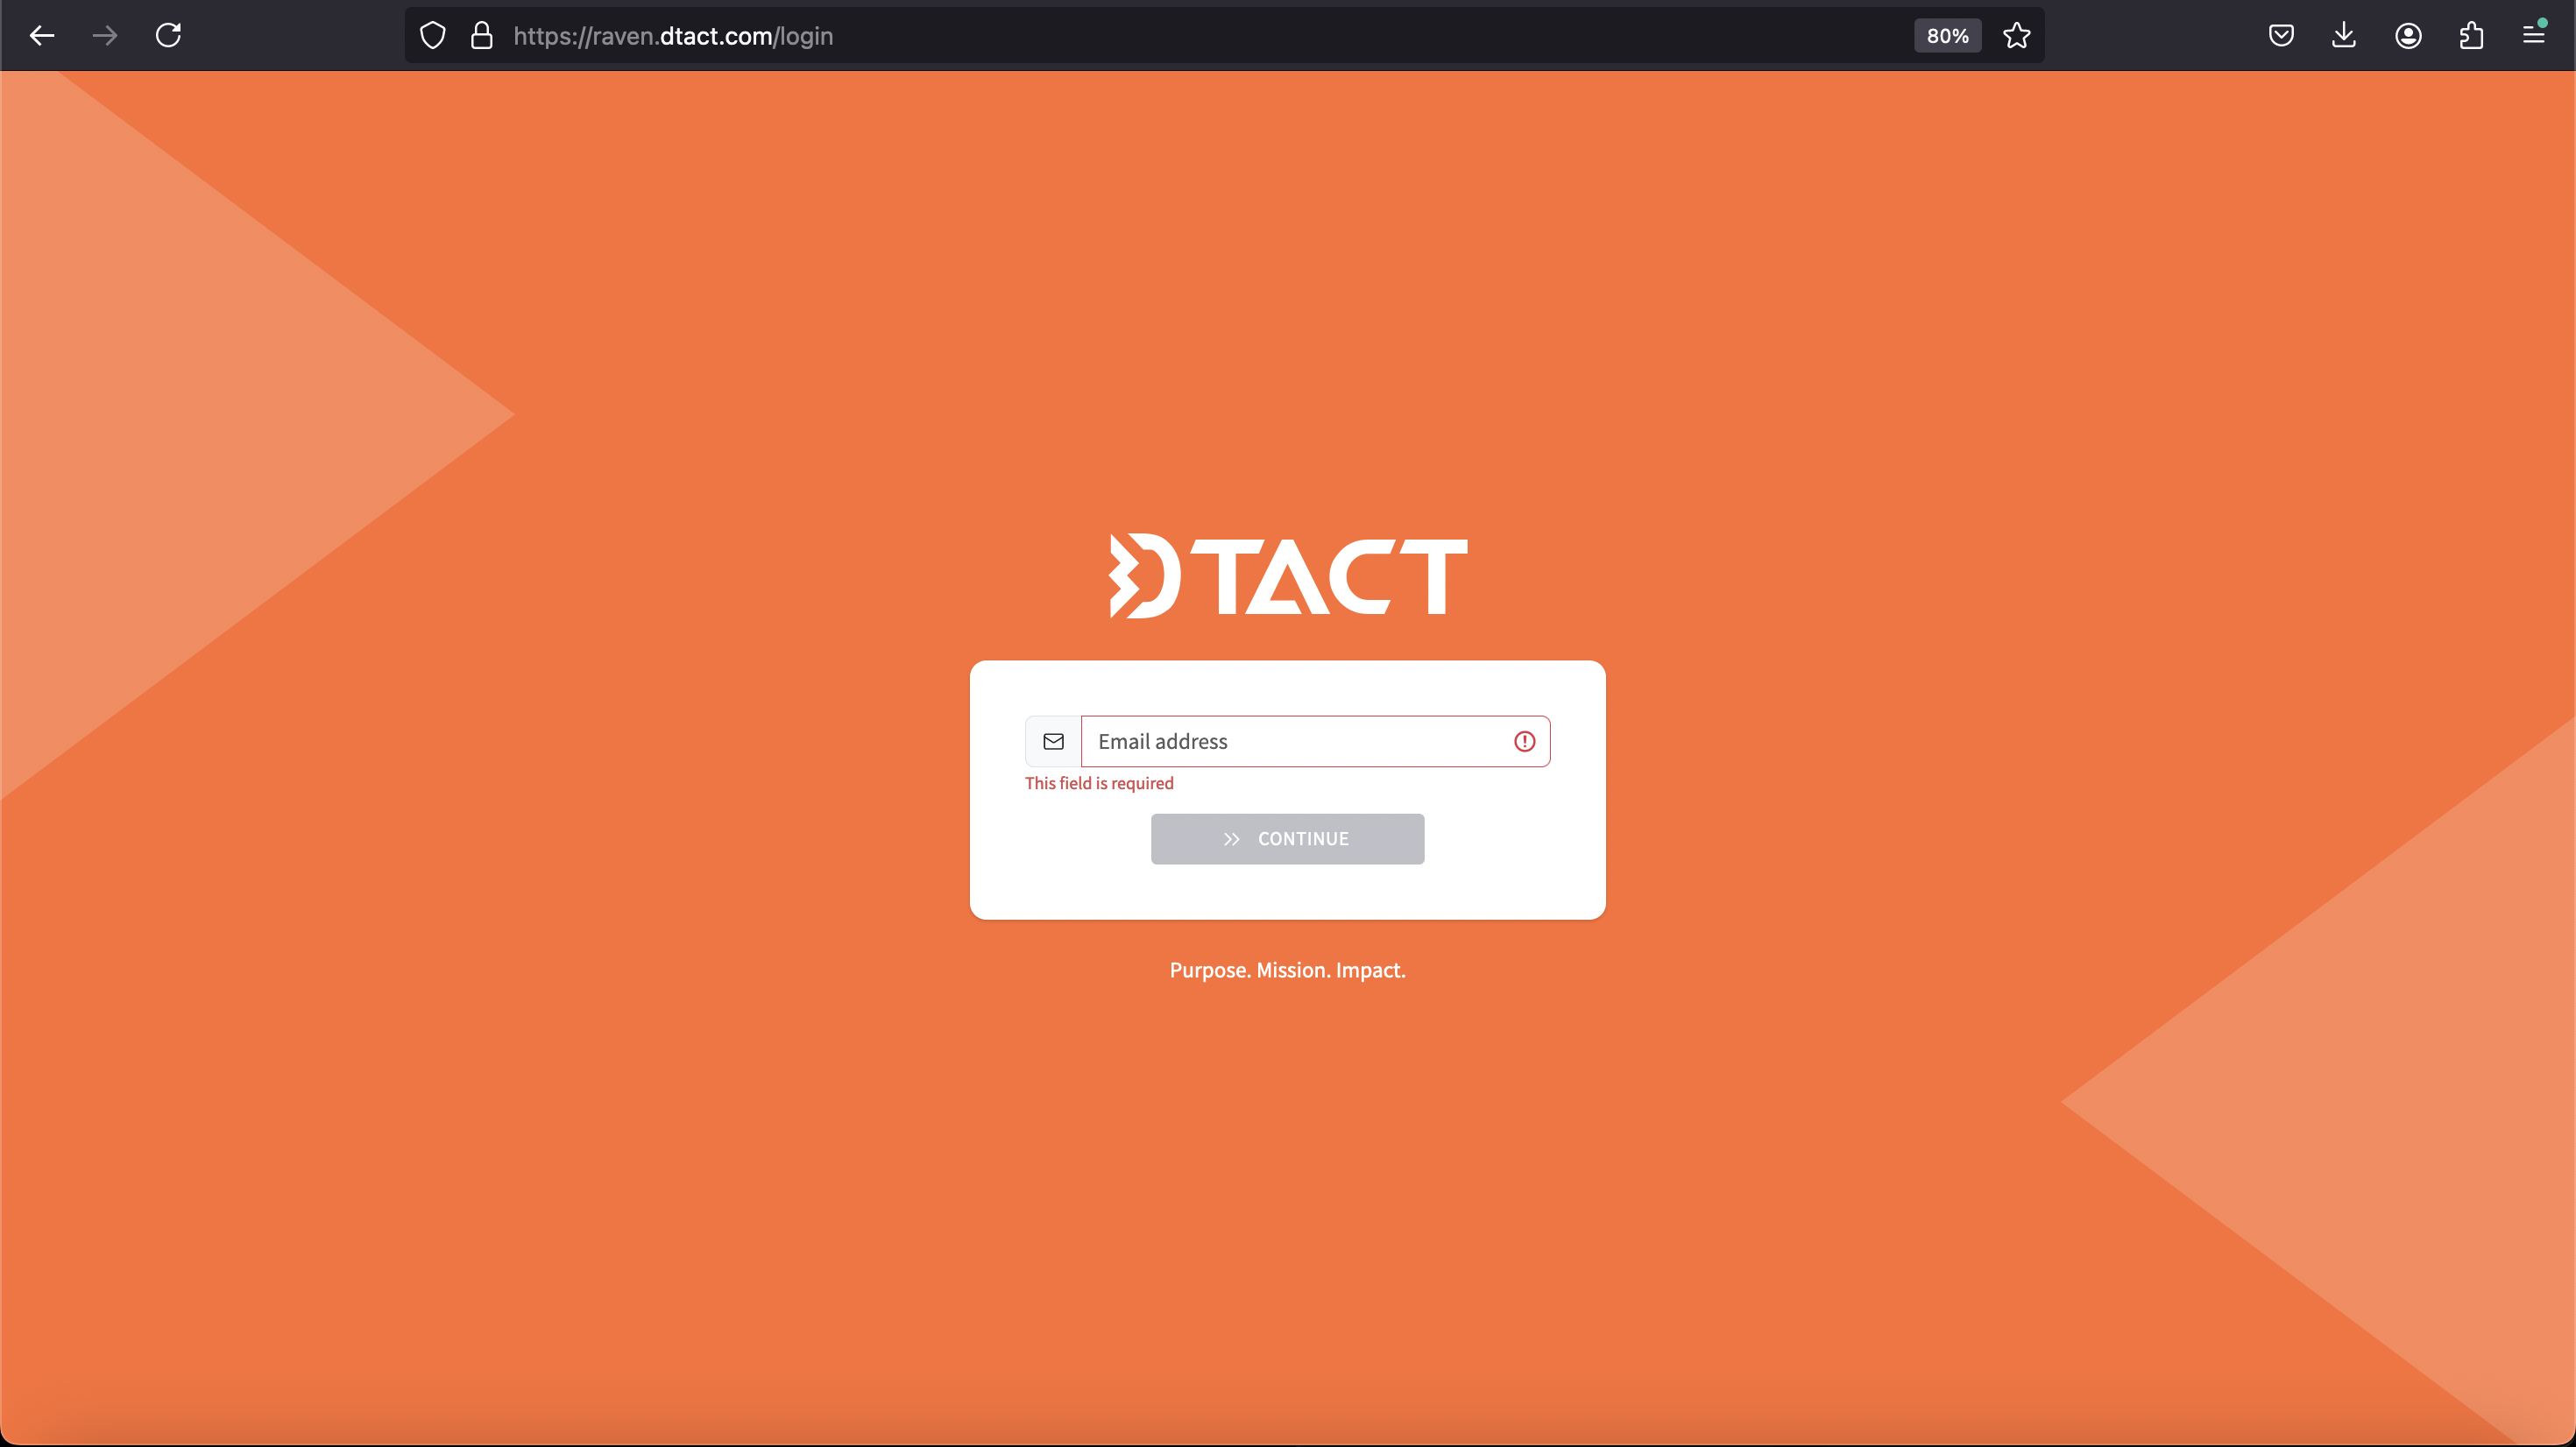
You will receive an email invitation to join a specific team for collaboration. Once you receive the email, click on the invitation and create your profile by entering your email and setting a password.

https://raven.dtact.com
Make sure to bookmark this link for easy access in the future.
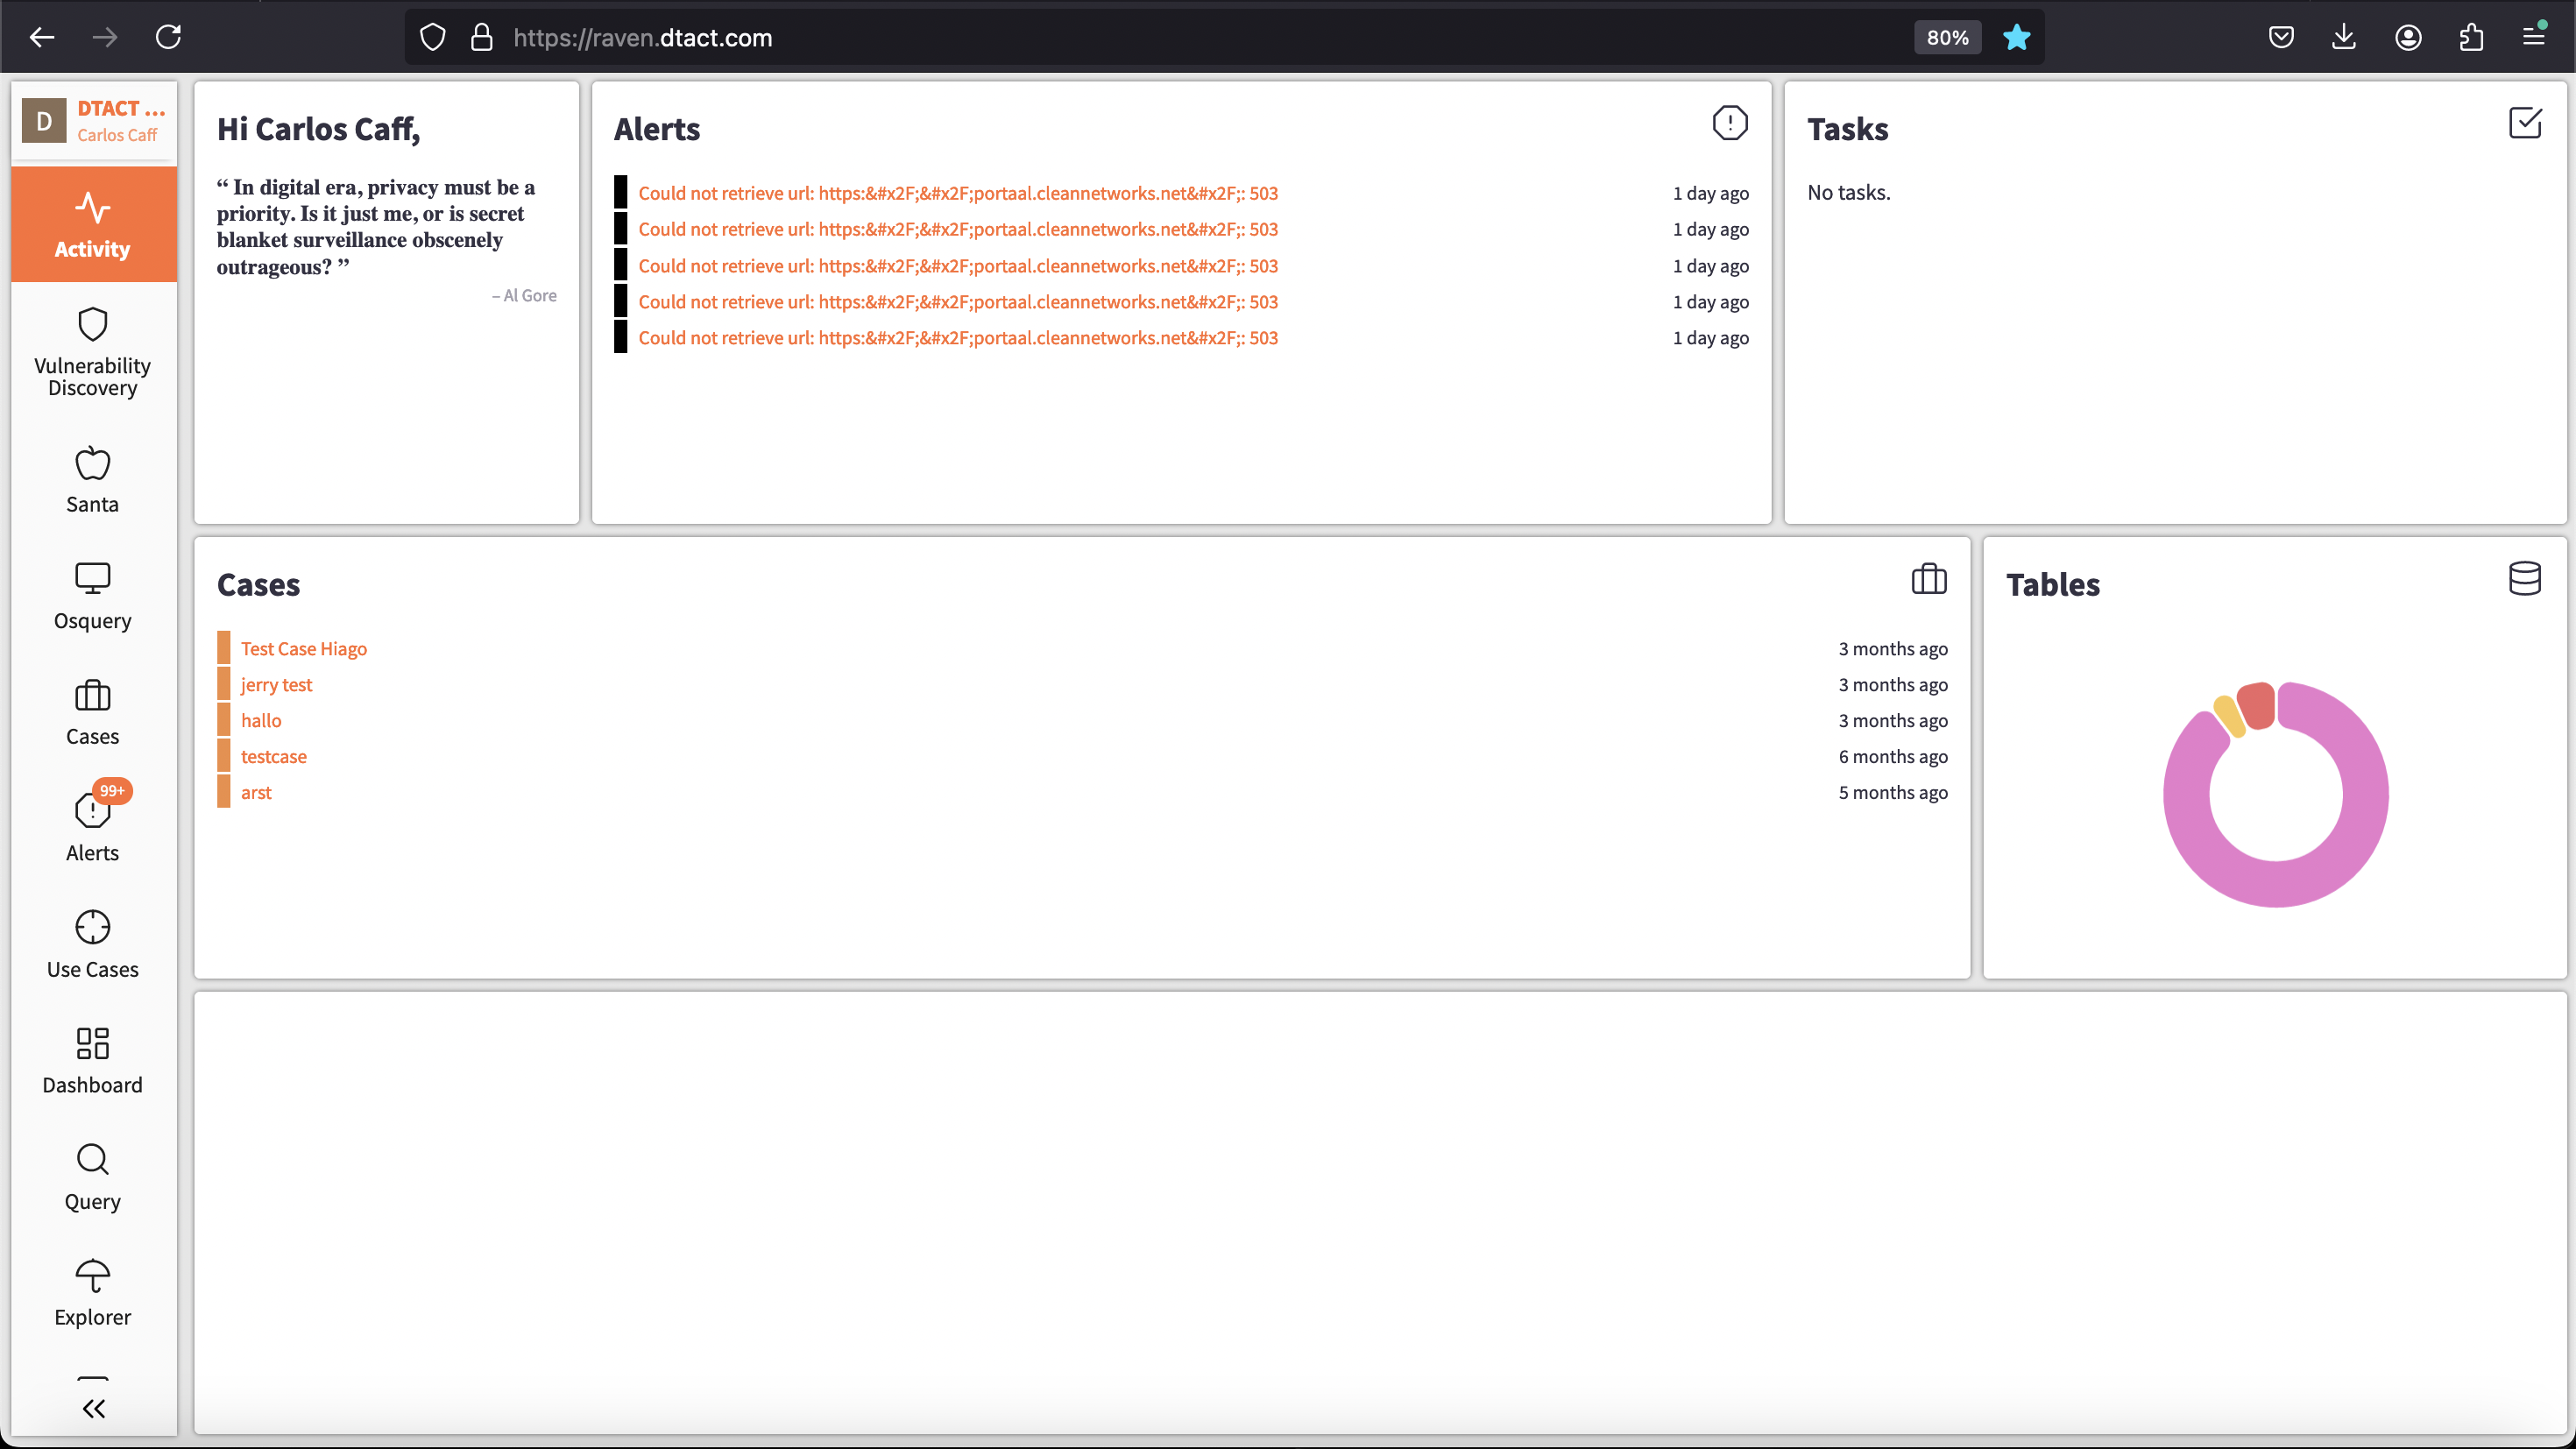
After logging in, you'll be directed to the main dashboard.

Here depending on the different data and business cases you have configured you will be able to see different information regarding your Tasks, Cases, Alerts and Tables.
What Can We Do in the Portal?
The portal is designed to give you full control over your data and workflows. Here’s an overview of what you can do:
-
View and Analyze Data: Access and analyze data using tables, reports, and custom visualizations.
-
Automate Workflows: Set up and manage automated workflows with the Flows tool.
-
Manage Tables and Data: Create, edit, and manage tables with real-time data connections.
-
Use Bricks for Automation: Utilize Bricks to integrate external services or automate tasks within your workflows.
Main Bricks Overview
Here are some of the key Bricks you'll work with:
-
Webhook Brick: Connects to external services or APIs to bring data into your flow.
-
Python Brick: Enables advanced data manipulation and scripting within a flow.
-
Send to Topic Brick: Links Playbooks and Flows, sending processed data to storage or external services.
-
Form Brick: Allows users to manually trigger flows via form submissions.
-
HTTP-Endpoint: This Brick lets you bring in data through a secure HTTPS endpoint, supporting formats like JSON and XML.
Example
Here’s what you can accomplish with the portal in a simple Business Case:
-
Data is collected from multiple sources (e.g., Excel files, APIs).
-
This data is automatically processed by a Flow and stored in a Table.
-
You create a Visualization to track key metrics in real-time.
-
When certain conditions are met (e.g., sales targets), an alert is triggered using a Web-hook Brick.