Tables User Documentation
| Purpose | In this document, we will take a closer look at two important capabilities provided by the Raven Portal, designed to boost user productivity and flexibility. These capabilities include Tables, which help you structure incoming data, and Query, which allows you to search and access this data efficiently. |
|---|
| Scope | This documentation comprises essential information that users require to create and effectively utilize tables. |
|---|
| Created | September 29, 2023 |
|---|
Tables: Structuring and Managing Data
Tables play a pivotal role in organizing and managing incoming data sources within the Raven Portal. They enable you to structure the data in a tabular format, facilitating easy manipulation and retrieval.
Supported Data Sources
Raven allows the creation of tables using various data sources:
Data straight from the flows
CSV files
JSON files
External data sources using dynamic table bricks, for example:
API
Elasticsearch
SQL databases
To access your Tables, navigate to the "Settings" section and select "Tables." Here, you can find essential information about your existing Tables:
- Name
- Description
- Type
- Record Count
- Data Size
- Creation Date
To create a new Table, click the "Create Table" button in the upper right corner. This action opens a configuration pane where you can provide details:
- Alias: A reference name for the table
- Description (optional)
- Table Type: Various types available, discussed later
Additional configuration options may vary depending on the chosen table type.
Save and create the Table by clicking the "Create Table" button at the bottom of the configuration pane.
Tables can also be created programmatically through Python and integrated into Raven Flows.
Types of Tables
Raven offers different types of Tables to suit your data needs:
Parquet: Utilizes Parquet files for creating a Table.
Parquet serves as the backend file format for Query, but it remains hidden from the end user's view.
For more information in Parquet files follow link below:
Brick: Uses Python Bricks to fetch data for Table creation.
You can configure the behavior of the Table in Brick Management and specify its data source.
This Table type can also be referred to as a dynamic Table.
One main difference between Parquet and Brick Tables is that Brick Tables dynamically grabs data from the workflow and the Parquet Table has to index it first.
Workflow: Retrieves data from an already created Brick and provides transformation capabilities letting you "transform" the information being retrieved.
Transforms use VRL language, for more information on VRL follow link below:
File: In this Table type you have the opportunity to upload files directly, such as JSON or CSV files, making them instantly accessible for querying purposes. This functionality simplifies the process of accessing and analyzing your data.
Table: Allows the creation of a new Table without affecting existing versions.
Configuring Table types
Parquet:
When you're setting up a Parquet Table, you'll be prompted to provide several key pieces of information:
Topic: This is where you specify the source from which the data is being extracted.
Transform: This allows you to choose a Transform Brick, which can be a crucial element in data processing and transformation.
Refresh Interval: Here, you define how often the data in your Parquet Table should be updated.
Sample Size: Specify the size of the sample data that will be used in your Parquet Table.
Batch Size: This is where you determine the size of data batches to be processed.
Retention Policy: Define how long the data should be retained in your Parquet Table.
Schema: Describe the structure and organization of the data.
Pick a Schema: This function is used to establish a mapping for the schema.
Workflow
When creating a Workflow Table, you'll need to provide the following information:
Topic: Indicate the data source from which your Workflow Table will pull data.
Transform: Specify the transformation methods that will be applied to the data within the Workflow Table.
Schema: Define the structure of the data and how it should be organized.
Pick a Schema: This function is used to establish a mapping for the schema.
Only two types of Table configurations are shown because those are the two tables not using Brick Manager which is at the moment for internal use only.
Creating a Python Table
Steps:
Go to the Raven Portal's "Settings" and select "Tables".
Click the "Create Table" button in the top right corner.
Fill in the form with the following details:
- Alias (name for referencing the table)
- Description (optional)
- Table Type (choose "Brick" for Python tables)
- Brick (select from the list)
Once you choose a brick, additional options become available:
Main: The file containing the code for creating the table
Class Name: Name of the class responsible for creating the table within the chosen file
EventStore (optional)
Secret
for more information follow the link below:
Schema: Specify column details, see below for schema attributes
Schema Attributes
Define the schema for your table with these attributes:
name: Column name
nullable: Specifies if the column can contain null values
dict_id: Required for certain packages like pyarrow
set to
0if not neededdict_is_ordered: Required for certain packages like pyarrow
set to
falseif not neededdata_type: Data type of the column
Supported data types:
Utf8 (for strings)
Int64 or Int32 (for integers)
Float64 or Float32 (for floating-point numbers)
Boolean (for boolean values)
{"Timestamp":["Unit","TZ"]} (for timestamps)
Unit (unit used for float value conversion, e.g., Day, Hour, Minute)
TZ (optional timezone information)
metadata (additional metadata for the column)
Example schema structure:
{ "fields": [ { "name": "<Insert column name here>", "nullable": true, "dict_id": 0, "dict_is_ordered": false, "metadata": {}, "data_type": "<Insert data type here>" } ], "metadata": {} }`
Query: Indexing Table
A Query provides a means to index Tables and Brick data using PostgresSQL and PRQL languages. This querying process allows you to extract specific data subsets as needed.
For more information on PostgresSQL and PRQL languages follow links bellow:
Another method for Querying the data involves using Prompt. Prompt uses ChatGPT to assist in generating the Schema for your Queries. It's important to note that ChatGPT does not have access to your data; it only provides guidance to the app on how to index the Table.
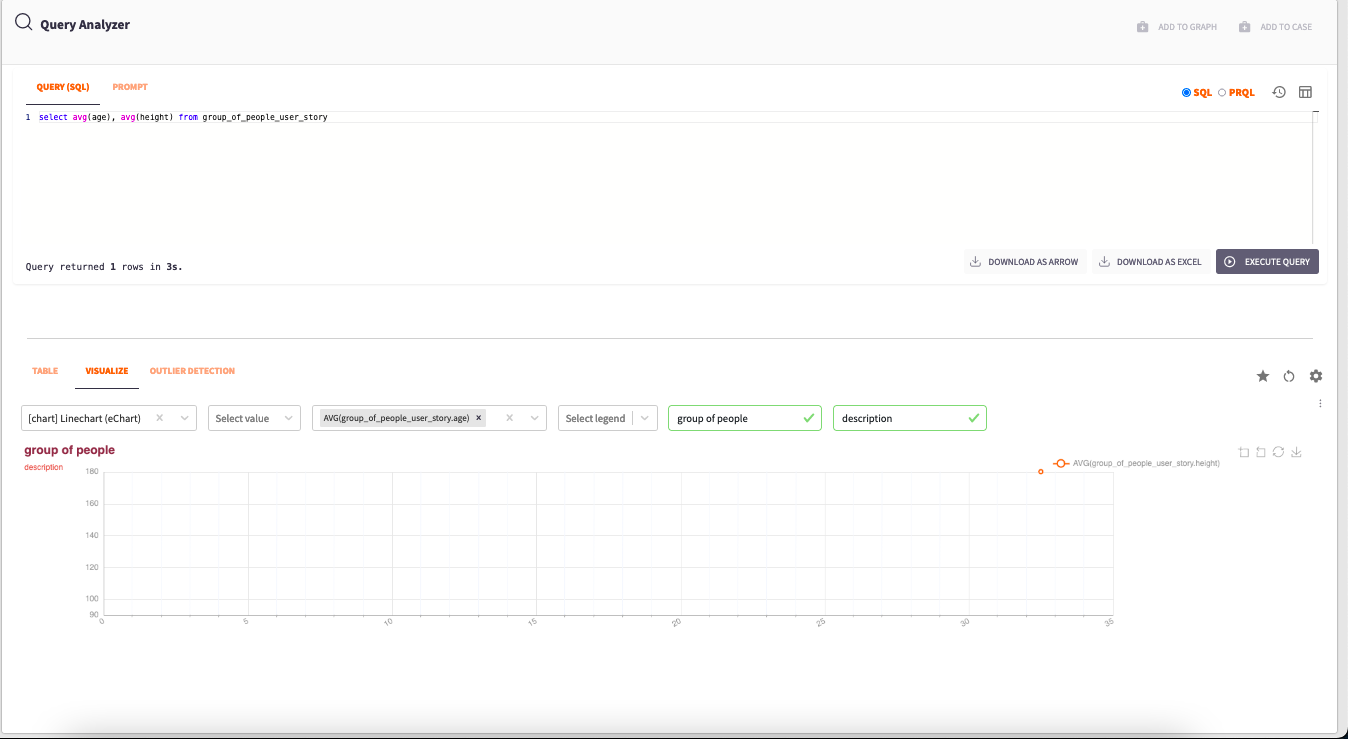
You can access the "Query" app to interact with your Tables. Here's how it works:
Select the "Query" app to open a tab where you can index your created Tables.
Write your Query in the provided section.
Below the Query section, you have three buttons:
Download as Arrow Document
Download as Excel File
Execute Query
When you execute the Query, the indexed Table appears below in the Table pane.
Next to the Table, you will find two panes:
Visualize: Are often referred to as Panes, is a feature that empowers users to transform tabular data into visually appealing graphs and charts.
For more information on Panes follow the link below:
Outlier Detection: Also known as anomaly detection, is a process of identifying data points that significantly differ from the majority of the data in a dataset. These data points are considered "outliers" because they are rare or unusual in comparison to the typical data points in the dataset.
Outliers can occur for various reasons, such as measurement errors, data corruption, or genuinely rare events.
At the right corner you will be able to find three icons:
- Save Query: This feature enables you to save your Query for future reference.
- Reset Table Settings to Default: If you've made any modifications to the Table, this button restores it to its default settings.
- Configure Data: This section allows you to customize how the various fields within the Tables are displayed. For instance, you can specify whether groups are defined by strings, booleans, objects, and more.
Query example with visualisation
Filtering Tables:
You can apply filters to Tables by hovering your mouse cursor over the various objects within the rows and columns. This action will reveal a funnel icon; click on this icon to filter the Table based on that object.
To remove a filter, simply click the "CLEAR" button located at the top of the Table.
Transformations: Enhancing Data Tables
Transformations enable you to modify data to meet specific requirements. Depending on the transformation type, you can select the Transformation Brick from the Table types and provide details such as topic, refresh interval, sample size, batch size, retention policy, and schema.
To explore the capabilities of a particular transformation brick, navigate to the code section of Brick Manager V2.
Creating and Managing Transformations
To create and manage Transformations:
Go to "Settings" and navigate to "Brick Management v2."
Click the "Create Brick" button to configure a new brick. Provide a name, description, type, and optionally add Python code by selecting the "code" pane and clicking "Add new file."
Save your changes by clicking the "Save" button in the top right corner.