Panes and Dashboards User Documentation
| Purpose | This documentation will guide you through the process of creating, managing, and effectively visualizing Panes and Dashboards, empowering you to harness their full potential. |
|---|
| Scope | This documentation provides essential insights and guidance for users to seamlessly create, utilize, and maximize the potential of Panes and Dashboards. |
|---|
| Created | October 9, 2023 |
|---|
Understanding Panes and Dashboards
Panes provide a user-friendly way of visualizing the Tables you have created. Rather than displaying data in the traditional rows and columns format, Panes offer an attractive visual overview.
Essentially, anything you can Query can be transformed into a Dashboard or Pane, offering a more intuitive representation.
Dashboards, on the other hand, are a collection of Panes, allowing you to group related visualizations together for an integrated view.
Creating and Managing Panes and Dashboards
Creating Panes
To create a Pane, visit the Query app in the left sidebar. This app is your tool for crafting queries to extract specific data from large datasets. Inside the Query app, look for the "Visualize" section at the bottom. This is where you can start building a visual representation, like a graph. Depending on the data in your table, you can choose from various chart types to make your data visually appealing and easy to understand.
Depending on the chart type selected, you will need to specify which data to display on the different axes. For example, if you opt for a Bar chart, you will define the data for both the "X" and "Y" axes.
For more information on the Query app follow link bellow:
Once you have configured the chart data, you'll find a button with three vertical dots in the upper right corner. Clicking on this button allows you to save the Pane. After selecting "Save," a tab will prompt you to enter:
Name
Description
Cron
For more information on Cron follow link bellow:
After completing this information, click the "SAVE" button.
You can access all created Panes, both yours and those of your teammates, by going to the "Dashboard" app and selecting the "Panes" section. Here, you can also manage Panes by clicking the three-dotted button in the top right corner of each Pane, which enables you to clone or delete a Pane.
Upon selecting a desired Pane, you can view its contents and edit its name and description by clicking the "EDIT" button located in the top right corner.
Creating Dashboards
To create a Dashboard within the Portal, navigate to the "Dashboard" app. This will open a tab displaying all the Dashboards created by you and your team members.
To manage your Dashboards, click on the three-dotted button in the top right corner of each Dashboard. Depending on your roles and permissions, you may not only view but also create new Dashboards by clicking the "CREATE DASHBOARD" button located in the top right corner of the tab. Here, you can select the desired Panes to add to your Dashboard.
Once you click on "CREATE DASHBOARD," a blank canvas will appear. You can start structuring your Dashboard by clicking on the "EDIT" button located at the top right corner. In this editing mode, you will be able to add a title and a description on the top left corner.
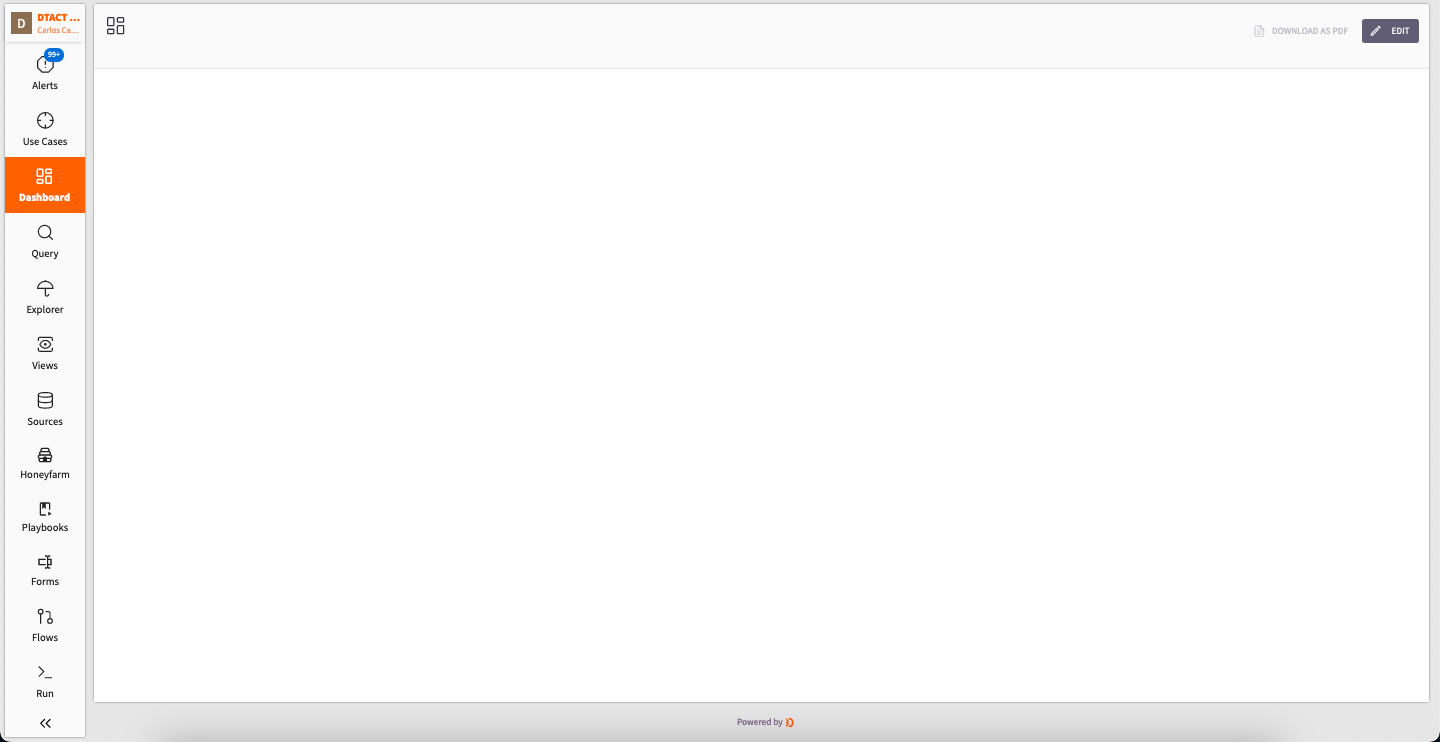
Empty Dashboard, here you can start adding panes and configurations.
In the top right corner, you will find three buttons:
ADD PANE
Clicking this button opens a window with two sections. The first section, "Panes," provides access to all Panes previously created by your team. Here, you can select and add them to the canvas.
Once you select the desired Pane, it will be placed on the canvas. You can move each Pane around to arrange your Dashboard. Each Pane added to the canvas includes three buttons at the top right:
Duplicate Pane: Creates an exact copy of the Pane.
Delete Pane: Allows you to remove unwanted Panes.
Settings: This option may be used to update Pane information or configuration (Note: This section is currently blank).
The second section, "Layout," provides tools to structure your Dashboard:
Header Text: You can add a header text to your Dashboard, allowing you to name different sections if desired. In the Settings button, you can change the header's appearance. Click "Update Pane" at the bottom of the section to save changes. Additionally, hovering over the Header Text allows you to adjust its size.
Horizontal Line: Adds a horizontal line to the Dashboard, enabling you to divide it into different sections.
Markdown: This option allows you to include a text block in Markdown syntax. You can edit the text inside the text block via the Settings button. Press "Update Pane" at the bottom of the section to save changes.
For more information on Markdown Syntax follow link below:
Image: Use this feature to add images into your Dashboard. By selecting the Settings button, you can paste the image's URL to upload your desired image.
Cancel
Allows you to discard any modifications you have made to the Dashboard that you do not wish to save. This feature is convenient when you have made changes but decide not to proceed with them.
Save
Allows you to preserve any modifications or adjustments you've made to the Dashboard, ensuring that your work is securely stored for future reference and use.
Please ensure to save your changes after any updates are made.
Please note that exporting Panes and Dashboards is currently in development.
When you save a Pane or Dashboard, it becomes automatically accessible to your entire team for visualization.
Keep in mind that only team members can view saved Panes and Dashboards.