Visualizing data and creating dashboards
In this tutorial we will cover exploring data using Query Analyzer, creating a pane and building a dashboard. In the following example we will be showing data from a dummy data set from firewall logs. You can follow the same steps with any type of data that are integrated in your Raven team.
Exploring Your Data
-
In the navigation bar go to Insights > Query Analyzer.
-
Use SQL or PRQL to query data from all tables in your Raven team - we will be using SQL in the following example.
-
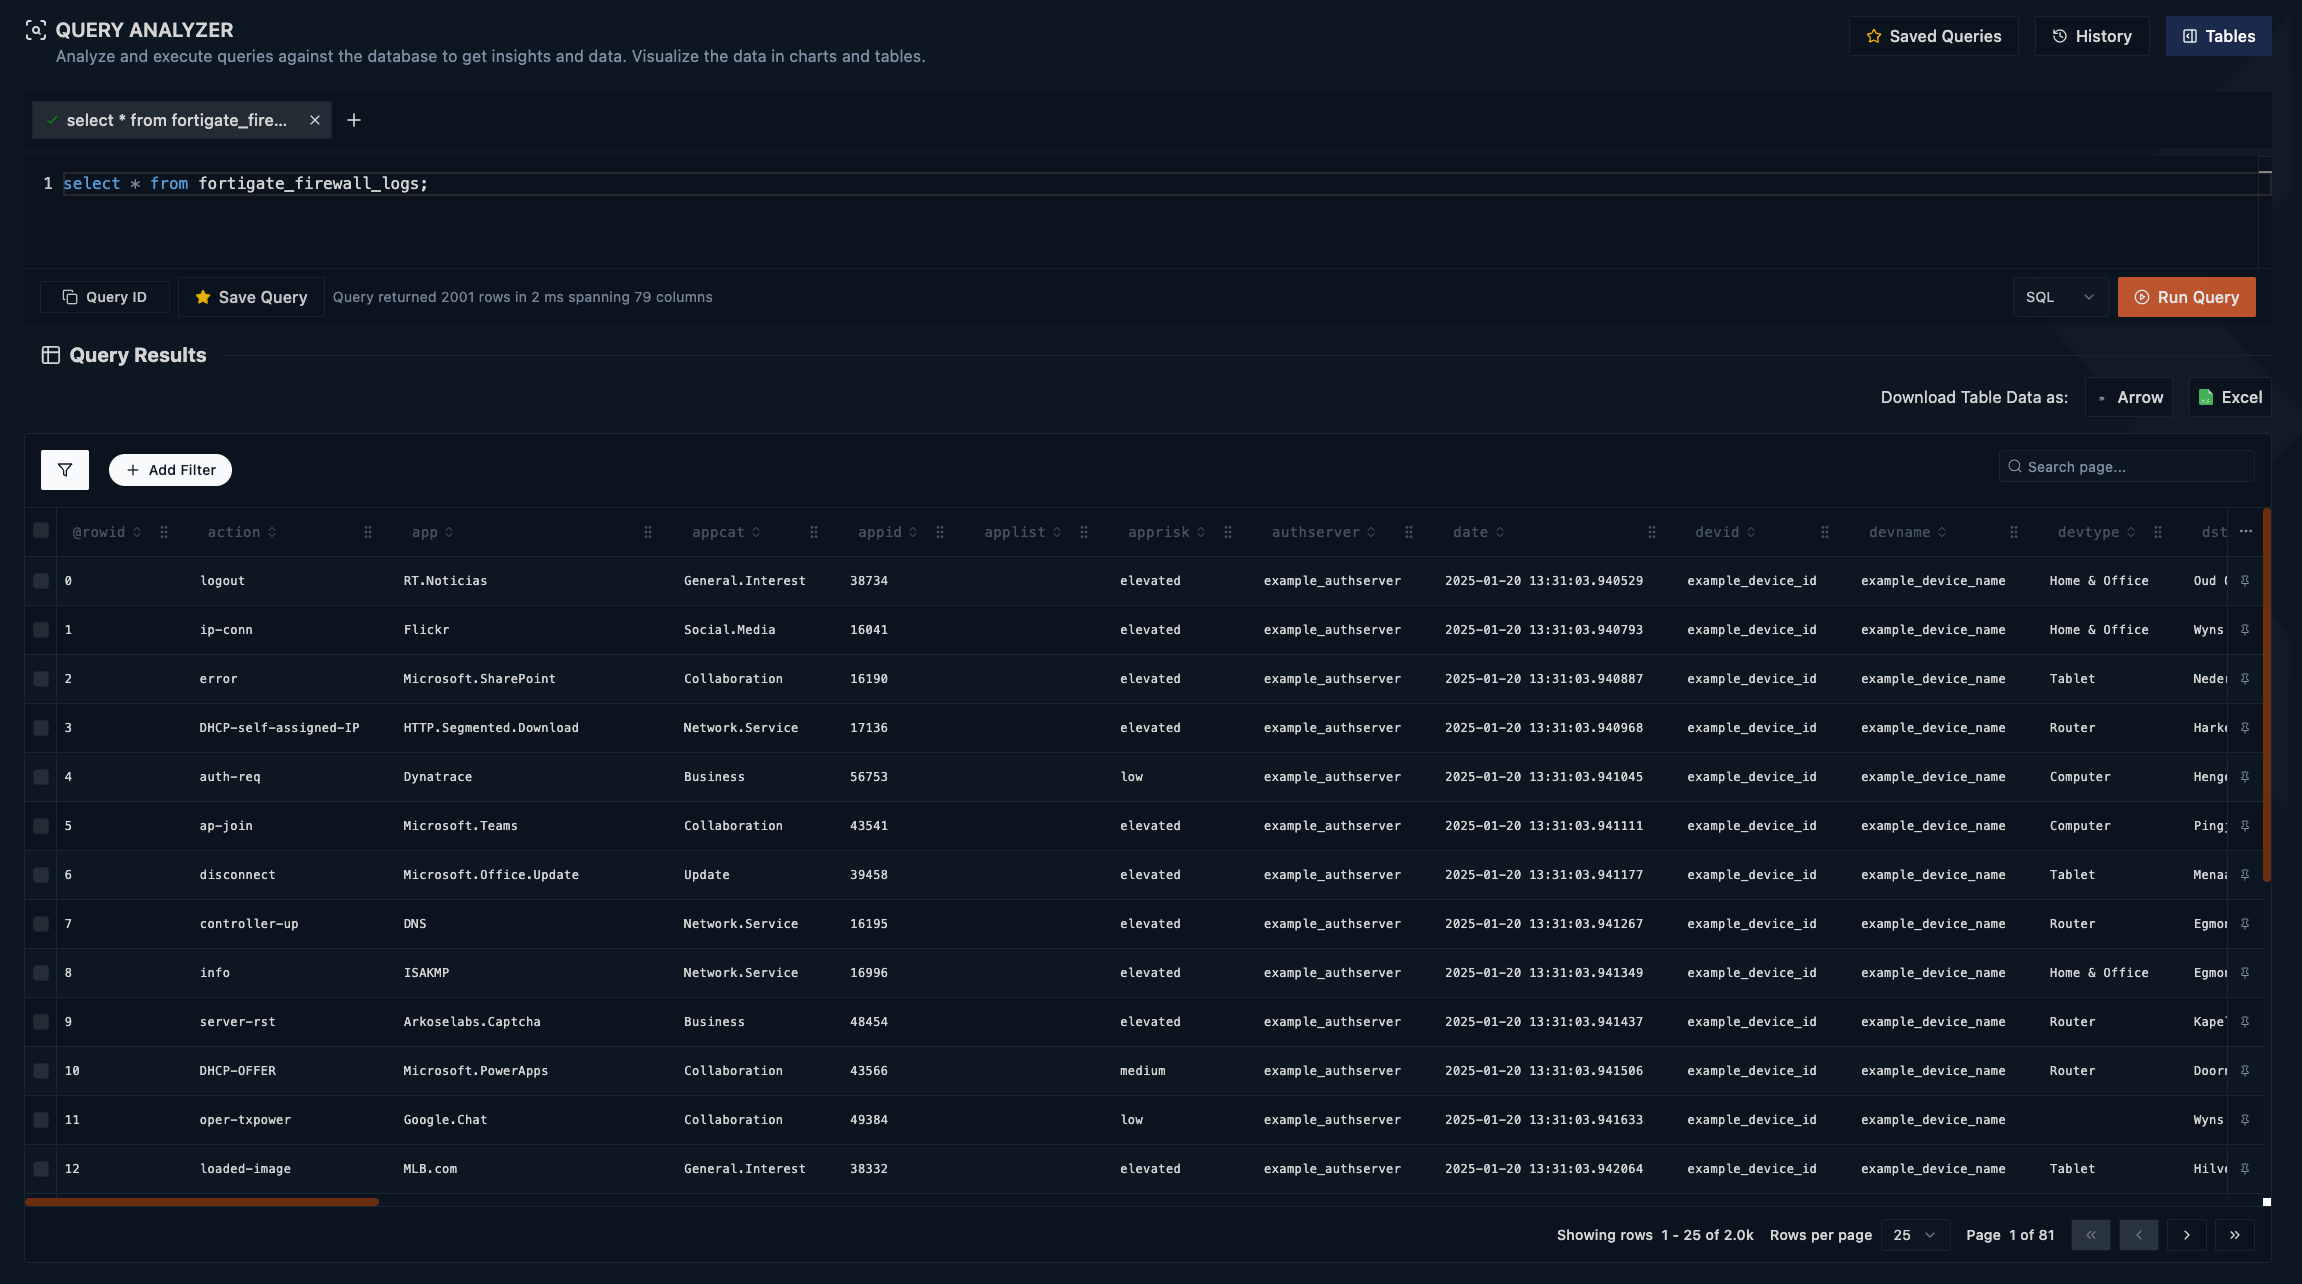
For this tutorial, we'll focus on the
fortigate_firewall_logstable.
For more information on querying, see the Query Analyzer documentation. Query Analyzer
Example query:
SELECT * FROM fortigate_firewall_logs;
Creating Visualizations
-
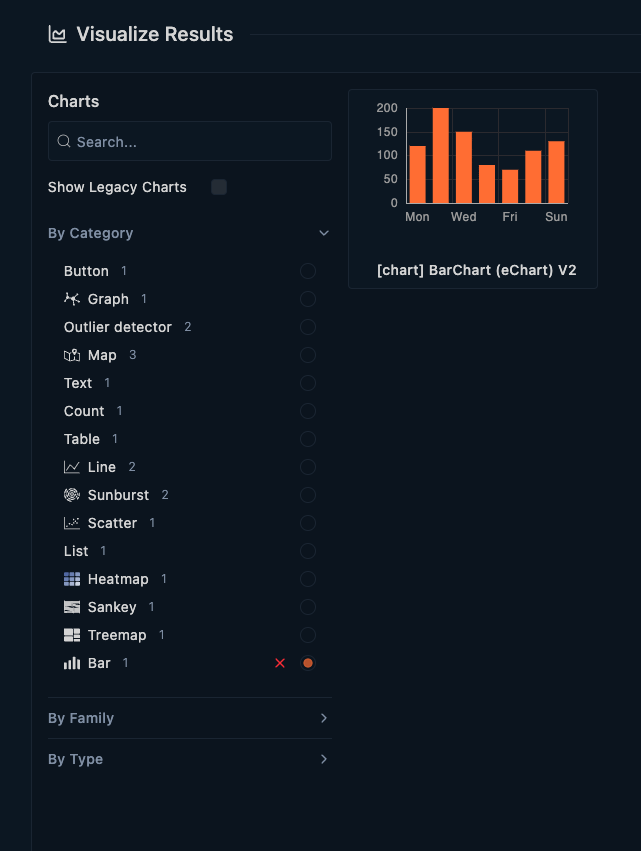
After running your query, scroll down to the Visualize Results section.
-
Choose a chart type from the available options, filtered by category, family, and type.
-
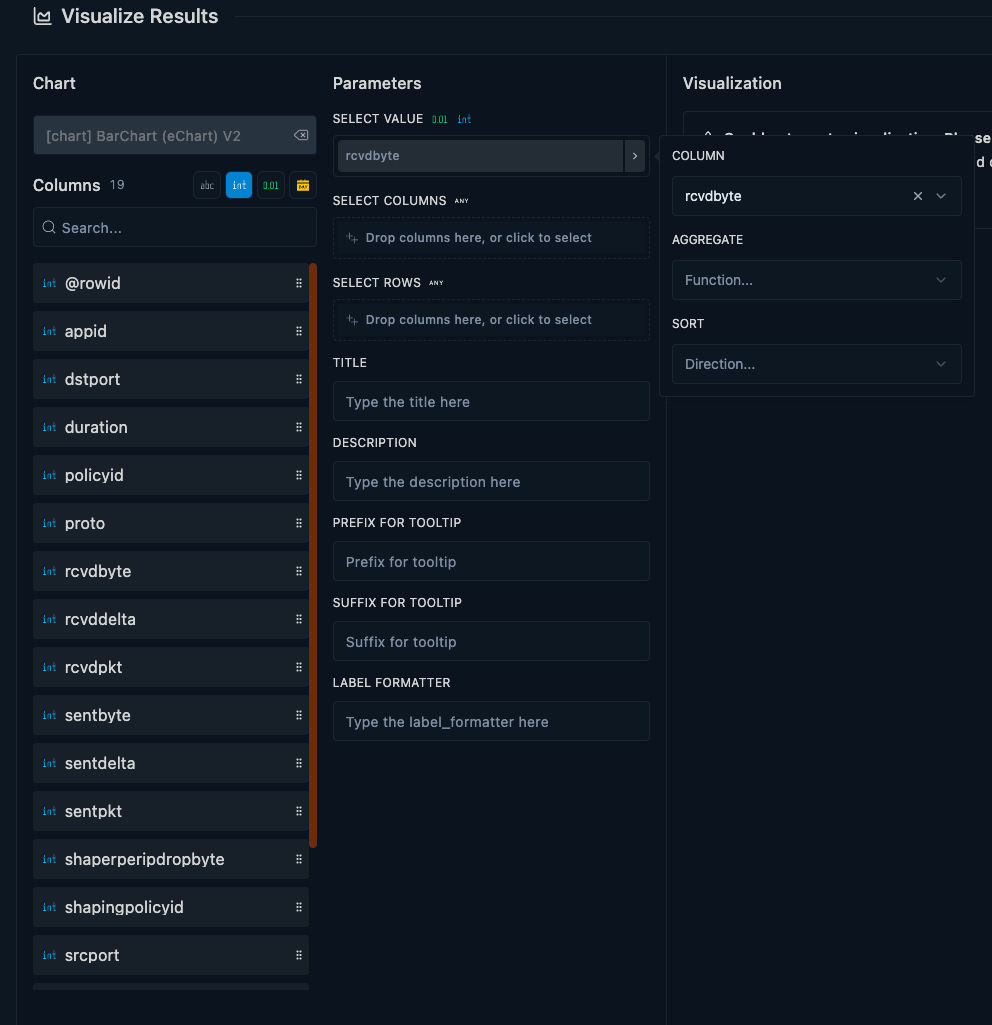
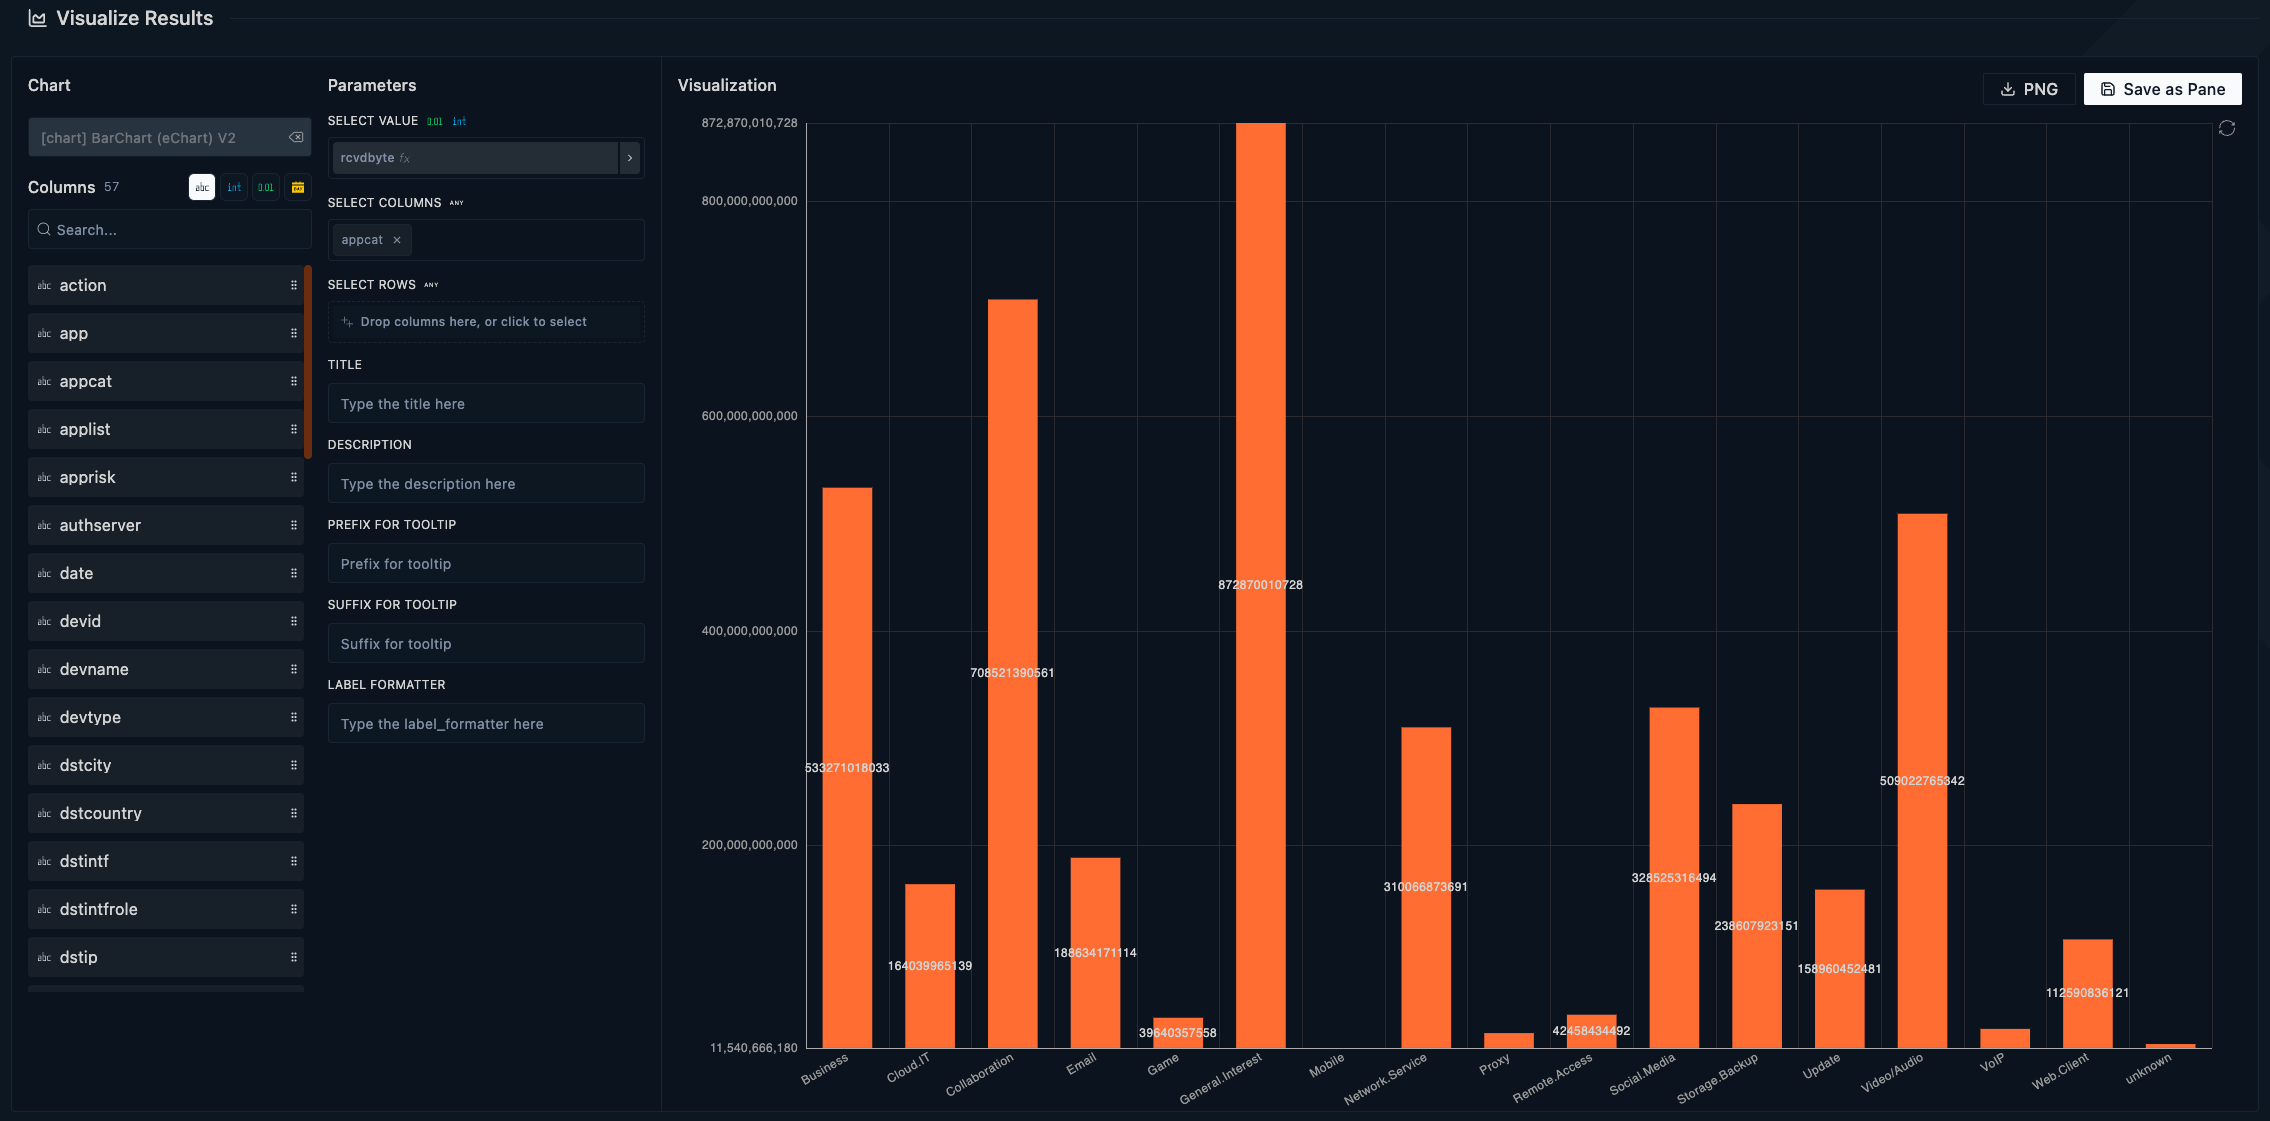
For this example, we'll create a simple bar chart:
-
Select the bar chart icon to open the no-code chart builder.
-
Drag 'rcvdbyte' to the Value parameter and select 'sum' as the aggregation.
-
Drag 'appcat' to the Columns parameter.
-
-
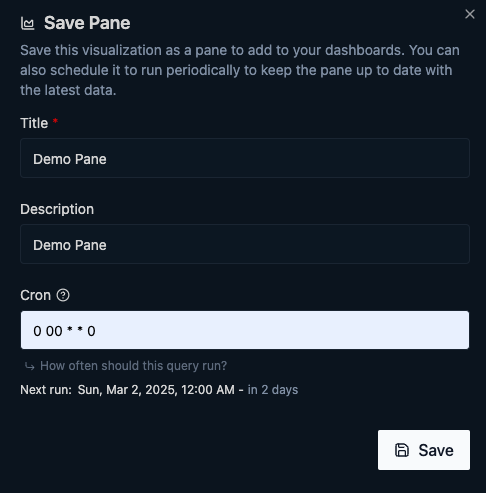
Save your visualization as a pane:
-
Click "Save Pane"
-
Set a title and refresh interval (cron)
-
For cron syntax help, see here
Building Your Dashboard
-
Open the Dashboards app.
-
Select an existing dashboard or create a new one.
-
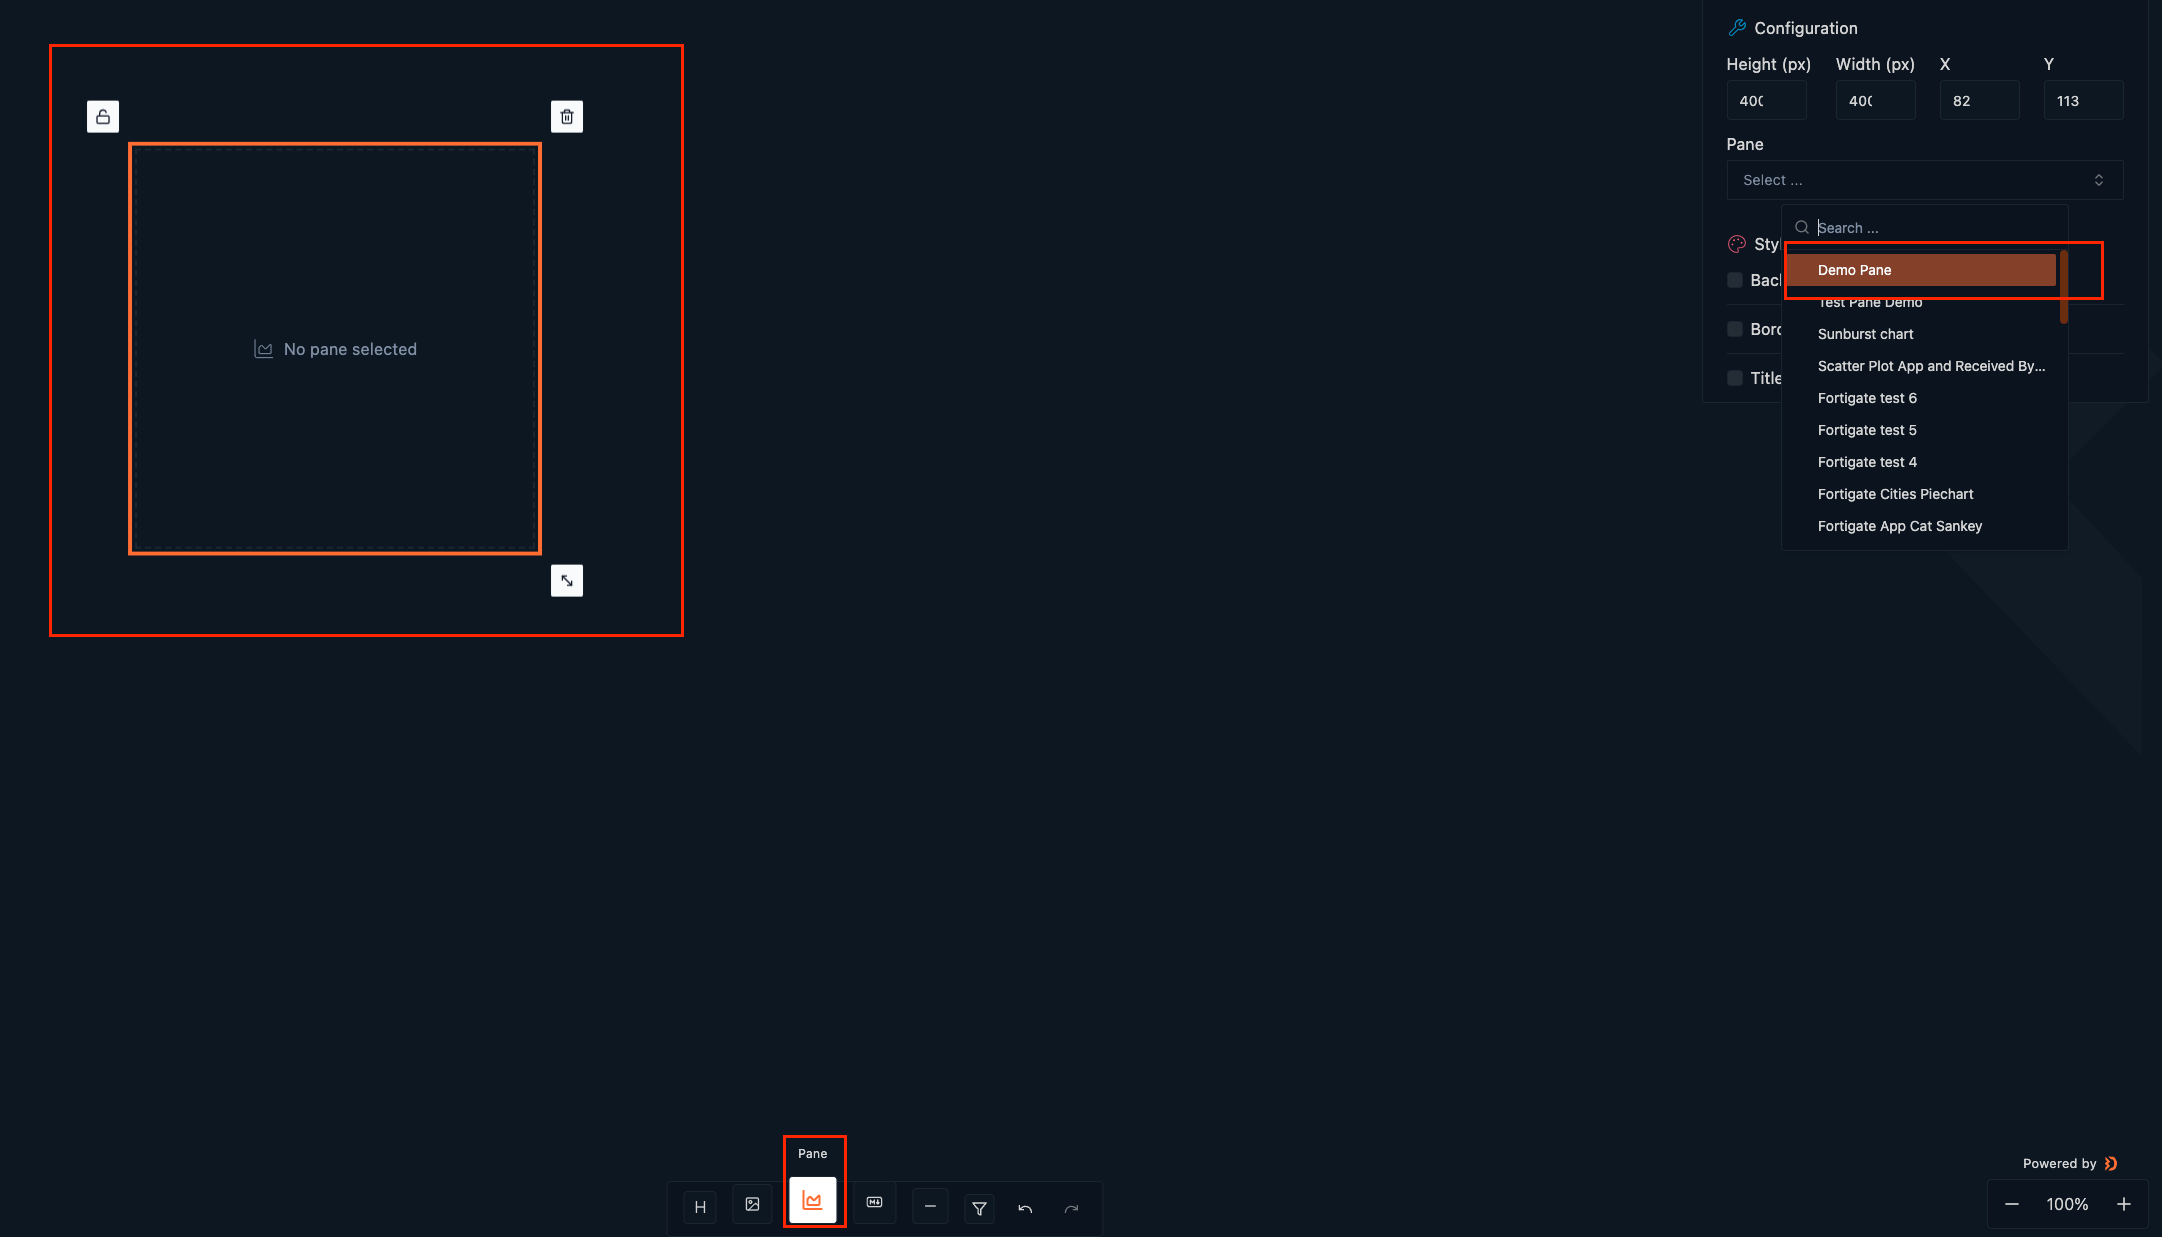
Add your pane:
-
Click the "Add Pane" option at the bottom of the dashboard.
-
Drag and drop your saved pane onto the dashboard.
-
Edit the pane by right-clicking or double-clicking.
-
-
Repeat to add multiple panes.
-
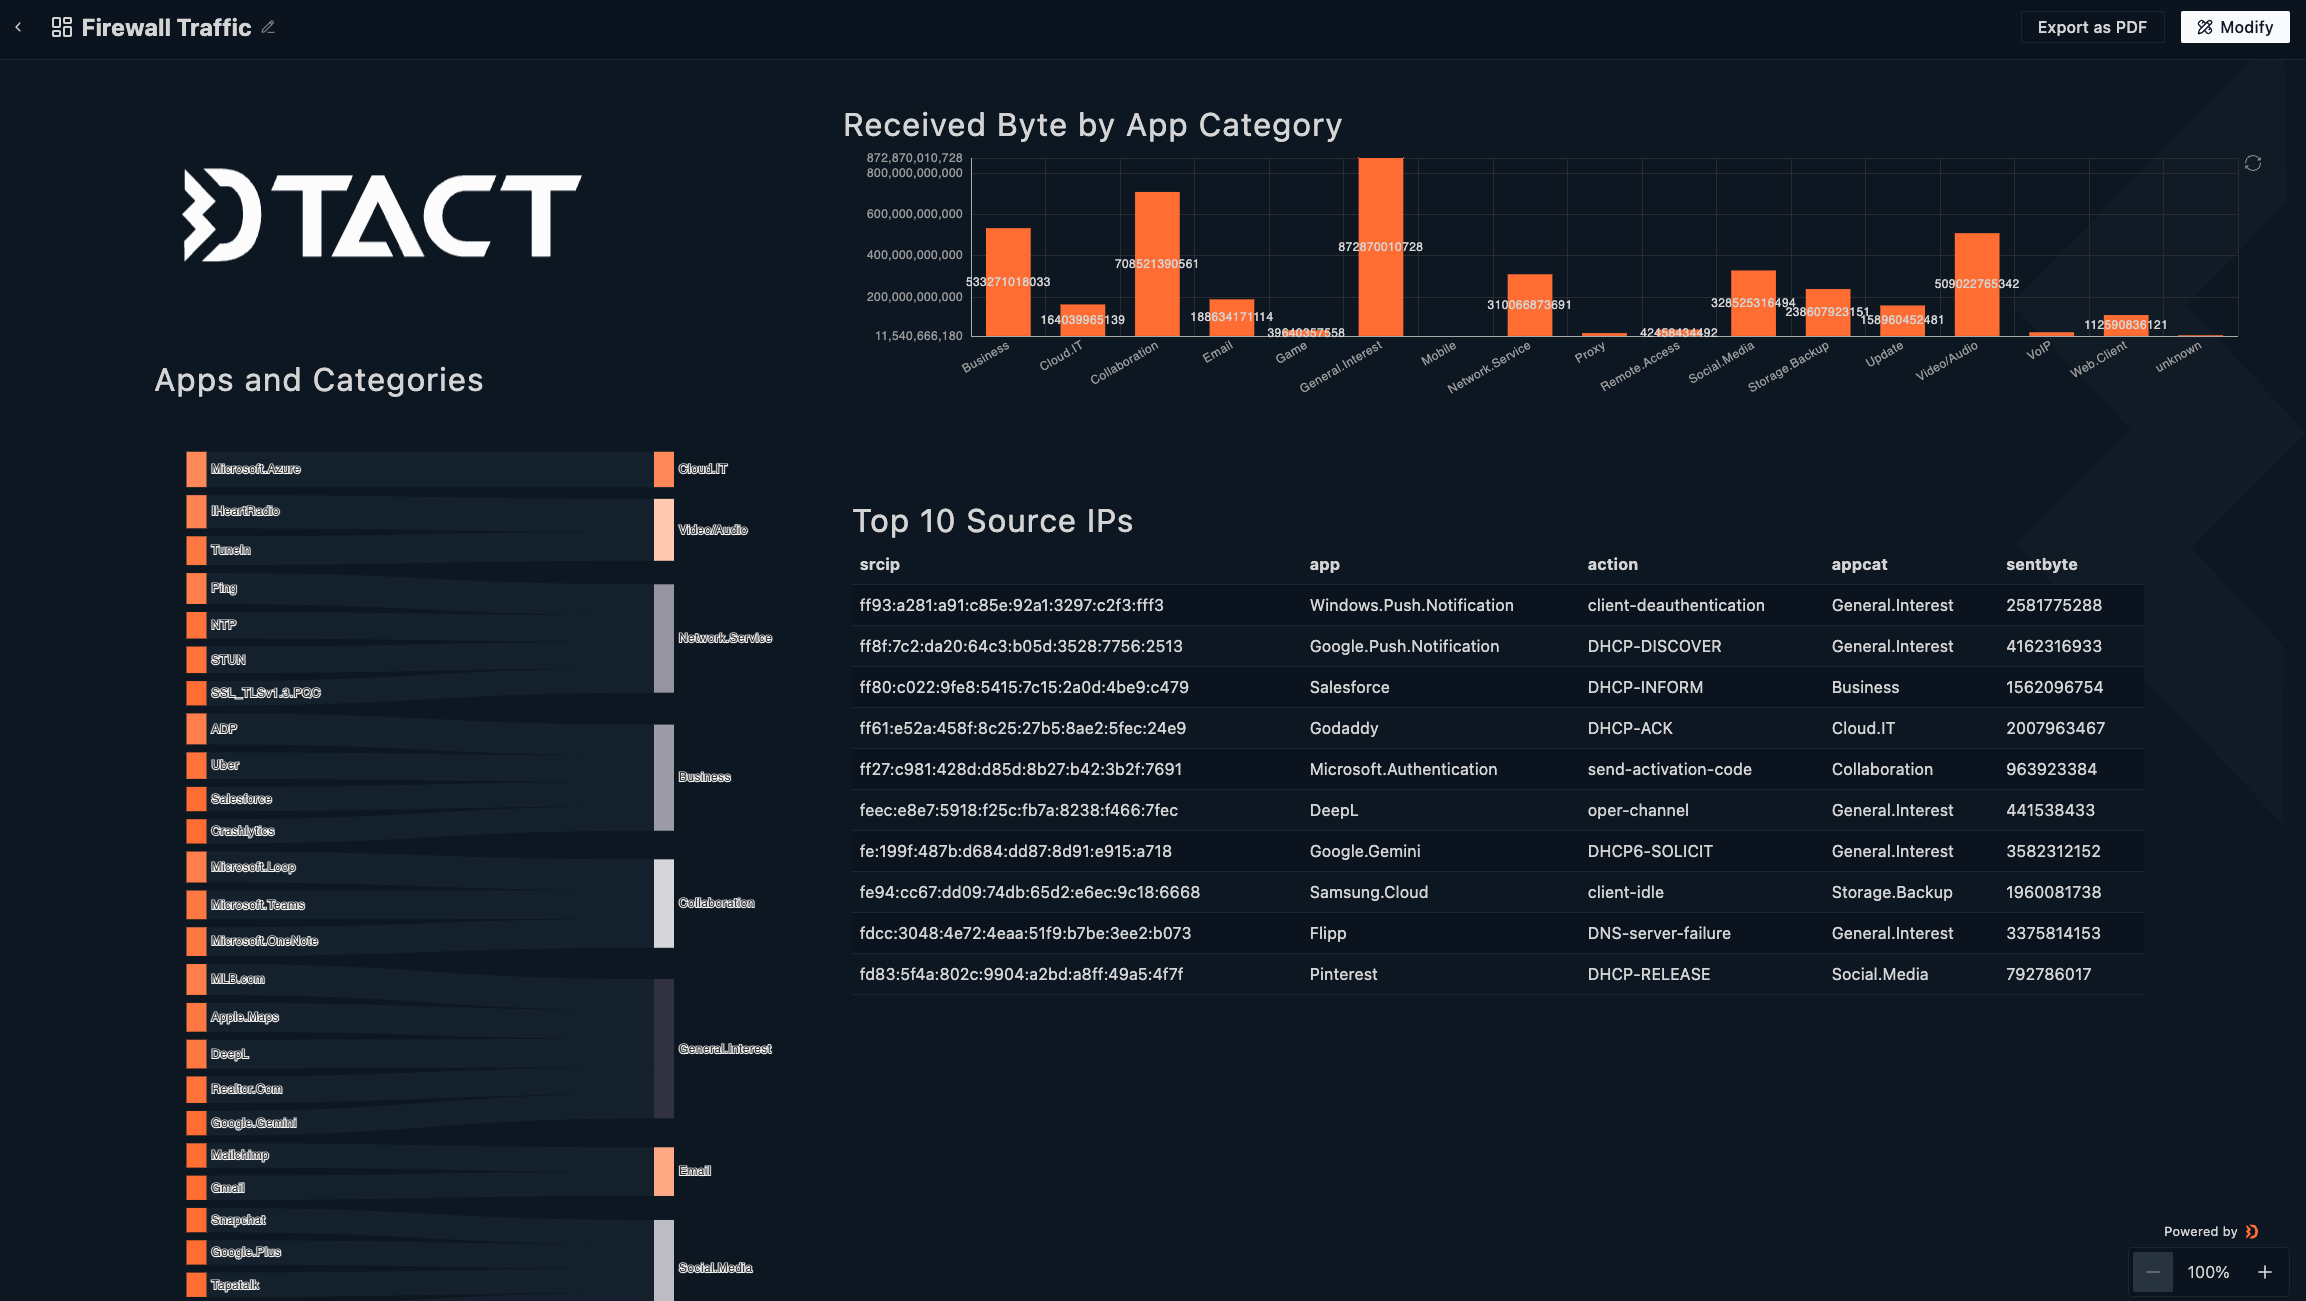
Save your dashboard when finished.
Your dashboard will be accessible to all team members within your Raven team. You can also export it to PDF using the provided option.
By following these steps, you'll create insightful visualizations and comprehensive dashboards to enhance your data analysis in Raven.