Insight Pane Brick.
| Purpose | Create visualizations, referred to as Insight Pane Bricks, to enhance and simplify the process of visualizing data within a table. |
|---|
| Created | September 10, 2024 |
|---|
| Components Used | Description |
|---|---|
| Brick Management | Brick management is a section of the portal where you can create, manage, and configure Bricks. |
| Query App | A Query provides a means to index Tables and Brick data using PostgresSQL and PRQL languages. This querying process allows you to extract specific data subsets as needed. |
| Visualize | Allows the visualization of data in a Table. |
Part 1
Create Insight Pane Brick
Access the Raven Portal: Navigate to the Raven Portal and go to the settings section. Locate the Brick Manager (v3), which will enable you to create new Bricks. Click the CREATE BRICK button in the top right corner.
Configuration Section:
-
Provide a name and a description for the Brick.
-
Choose the Brick type, which in this case should be the Chart type.
Code Section:
-
This is where you will input the Python script to configure the desired Chart.
-
Create a file to contain the script, and name it main.py.
-
Create a file to hold all the parameters for your Python script.
Code example:
class Chart:
    def __init__(self):
        pass

    def render(self, df, *args, **kwargs):
        import json
        import re
        from echart_panes.barchart import BarChart
        value = kwargs.get("value")
        columns = kwargs.get("columns")
        rows = kwargs.get("rows", [])
        title = kwargs.get("title", "")
        description = kwargs.get("description", "")
        tooltipvalueprefix = kwargs.get("tooltipvalueprefix", "")
        tooltipvaluesuffix = kwargs.get("tooltipvaluesuffix", "")
        label_formatter = kwargs.get("label_formatter", "{c}")

        df[value] = df[value].astype('int')

        pane = BarChart(
            df=df,
            value=value,
            columns=columns,
            rows=rows,
            title=title,
            description=description,
            label_formatter=label_formatter,
            tooltipvalueprefix=tooltipvalueprefix,
            tooltipvaluesuffix=tooltipvaluesuffix
        )
        chart = json.dumps(pane.generate_options())

        return Chart(content_type="application/vnd.echart+json", data=chart)
Code explanation:
A. Initialization Method
init Method: The constructor method is defined but does not perform any actions or initialize any attributes. It's essentially a placeholder in this case.
B. render Method
render Method: This method generates a JSON configuration for a bar chart visualization using the data provided.
Imports:
json is used to convert the chart configuration to a JSON string.
BarChart is imported from echart_panes.barchart, which is presumably a class that generates bar charts.
C. Extract Parameters
kwargs.get("key"): Retrieves optional parameters from kwargs. If a parameter is not provided, default values are used:
value: The column in the DataFrame to use for the bar values.
columns: Columns to include in the chart.
rows: Data rows to include in the chart (defaults to an empty list if not provided).
title: Title of the chart.
description: Description for the chart.
tooltipvalueprefix: Prefix for the tooltip value.
tooltipvaluesuffix: Suffix for the tooltip value.
label_formatter: Format for the labels on the chart.
D. Process Data
Convert Data Type: Ensures that the values in the specified column are integers. This is likely required by the BarChart class for proper rendering.
E. Create BarChart Instance
BarChart Instance: Creates an instance of the BarChart class, passing in the parameters extracted earlier. This instance will be used to generate the chart configuration.
E. Generate JSON Configuration
Generate Options: Calls pane.generate_options() to get the chart configuration, then converts it to a JSON string using json.dumps(). This JSON string represents the configuration for the bar chart.
F. Return Chart Object
Return Statement: Returns a new Chart object with:
content_type: Specifies the MIME type for the chart data, indicating that it's in ECharts JSON format.
data: Contains the JSON string of the chart configuration.
Parameters example:
{
    "params": [
        {
            "name": "value",
            "default": "",
            "label": "Select value",
            "placeholder": "Select value",
            "type": "column",
            "types": ["int64", "float32", "float64"]
        },
        {
            "name": "columns",
            "default": [],
            "label": "Select columns",
            "placeholder": "Select columns",
            "type": "columns"
        },
        {
            "name": "rows",
            "default": [],
            "label": "Select rows",
            "placeholder": "Select rows",
            "type": "columns"
        },
        {
            "name": "title",
            "default": "",
            "label": "Title",
            "placeholder": "Type the title here",
            "type": "text"
        },
        {
            "name": "description",
            "default": "",
            "label": "Description",
            "placeholder": "Type the description here",
            "type": "text"
        },
        {
            "name": "tooltipvalueprefix",
            "enabled": false,
            "default": "",
            "label": "Prefix for tooltip",
            "placeholder": "Prefix for tooltip",
            "type": "text"
        },
        {
            "name": "tooltipvaluesuffix",
            "enabled": false,
            "default": "",
            "label": "Suffix for tooltip",
            "placeholder": "Suffix for tooltip",
            "type": "text"
        },
        {
            "name": "label_formatter",
            "enabled": false,
            "default": "",
            "label": "Label Formatter",
            "placeholder": "Type the label_formatter here",
            "type": "text"
        }
    ]
}
Parameters Breakdown
value:
name: "value"
default: "" (empty string) – the default value if none is specified.
label: "Select value" – the label displayed in the UI for this parameter.
placeholder: "Select value" – placeholder text to show in the input field.
type: "column" – indicates that this parameter expects a column name from the data.
types: ["int64", "float32", "float64"] – specifies the data types acceptable for this column (integers and floating-point numbers).
columns:
name: "columns"
default: [] (empty list) – default value if none is specified.
label: "Select columns" – the label displayed in the UI.
placeholder: "Select columns" – placeholder text for selecting columns.
type: "columns" – indicates that this parameter expects a list of column names from the data.
rows:
name: "rows"
default: [] (empty list) – default value if none is specified.
label: "Select rows" – the label displayed in the UI.
placeholder: "Select rows" – placeholder text for selecting rows.
type: "columns" – indicates that this parameter expects a list of rows or a specification related to rows.
title:
name: "title"
default: "" (empty string) – default value if none is specified.
label: "Title" – the label displayed in the UI.
placeholder: "Type the title here" – placeholder text for entering the title.
type: "text" – indicates that this parameter expects text input.
description:
name: "description"
default: "" (empty string) – default value if none is specified.
label: "Description" – the label displayed in the UI.
placeholder: "Type the description here" – placeholder text for entering the description.
type: "text" – indicates that this parameter expects text input.
tooltipvalueprefix:
name: "tooltipvalueprefix"
enabled: false – indicates whether this parameter is enabled or not.
default: "" (empty string) – default value if none is specified.
label: "Prefix for tooltip" – the label displayed in the UI.
placeholder: "Prefix for tooltip" – placeholder text for entering a tooltip prefix.
type: "text" – indicates that this parameter expects text input.
tooltipvaluesuffix:
name: "tooltipvaluesuffix"
enabled: false – indicates whether this parameter is enabled or not.
default: "" (empty string) – default value if none is specified.
label: "Suffix for tooltip" – the label displayed in the UI.
placeholder: "Suffix for tooltip" – placeholder text for entering a tooltip suffix.
type: "text" – indicates that this parameter expects text input.
label_formatter:
name: "label_formatter"
enabled: false – indicates whether this parameter is enabled or not.
default: "" (empty string) – default value if none is specified.
label: "Label Formatter" – the label displayed in the UI.
placeholder: "Type the label_formatter here" – placeholder text for entering the label formatter.
type: "text" – indicates that this parameter expects text input.
Part 2
Query Table and Visualization
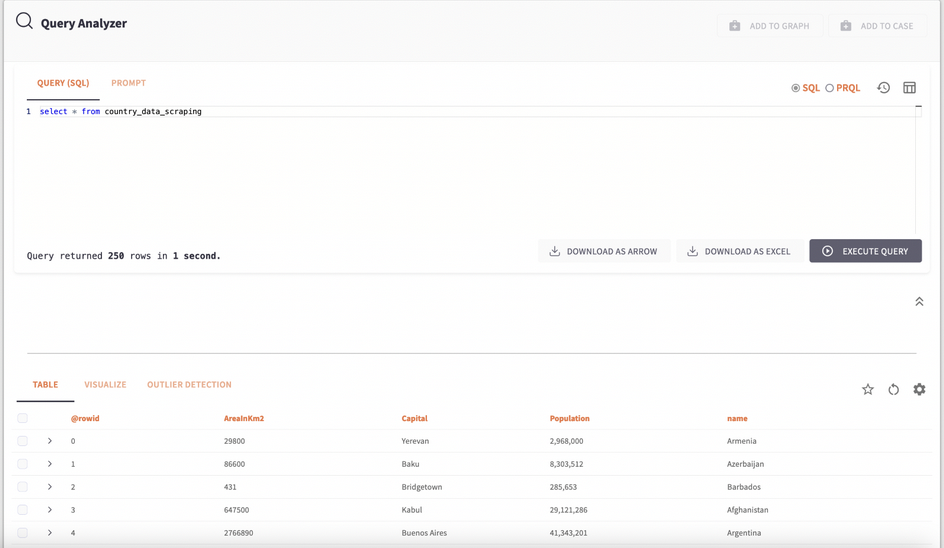
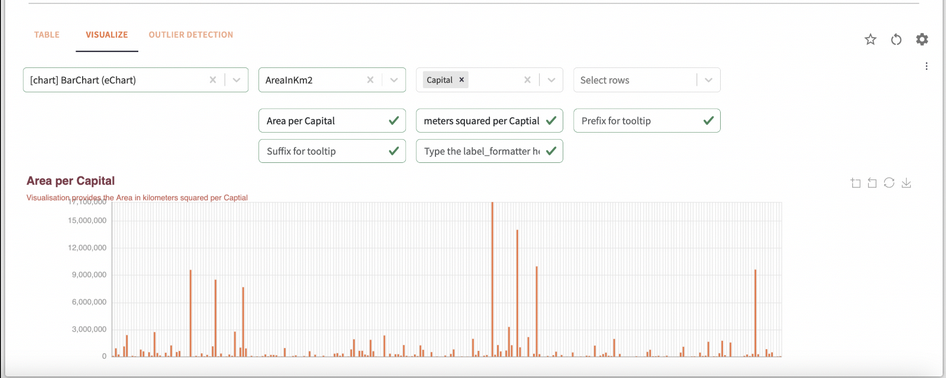
Navigate to the Query app and choose the table you wish to visualize. Once you've selected the table, you can proceed to configure and customize your visualization based on the data within that table. This will allow you to effectively transform raw data into meaningful insights through various visualization options available in the app.

